It’s an occupational hazard of being a portfolio manager: No matter where we go, we’re asked what we think about “the market”, which direction stocks are headed, our favorite stock ideas, and what sectors are most appealing. At the risk of disappointing interested parties, this isn’t how we approach our job.
At Heartland, we are not in the business of trying to guess the next hot stock or predict market movements on any given day. Instead, we seek to determine what the market is pricing into individual stocks, so we can identify cases of mispricing that represent long-term opportunities.
What are some other big misconceptions about what we do?
If you ever see analysts on television describing a stock they follow, you’ll often hear them discuss their “price target,” which is where they believe share prices should be headed over a relatively short time frame, say the next 12 to 18 months, although research shows that the average holding period of a stock is well under a year. We don’t believe that we — or anyone else, for that matter — can accurately project where a company’s equity will trade with precision over a short period of time.
Instead, we have a process that allows us to think through multiple scenarios that could affect how the market might value companies under different situations. This gives us a framework for assessing stocks under four different conditions — two good and two bad — so that if circumstances change, we can act decisively.
Every time a company reports its financial statements, or we receive meaningful new information, we revisit our assumptions to determine if we need to change our price targets for any or all scenarios. We then compare upside rewards relative to downside risks across our portfolio, the benchmark, and our watchlist to determine our best bottoms-up uses and sources of incremental capital.
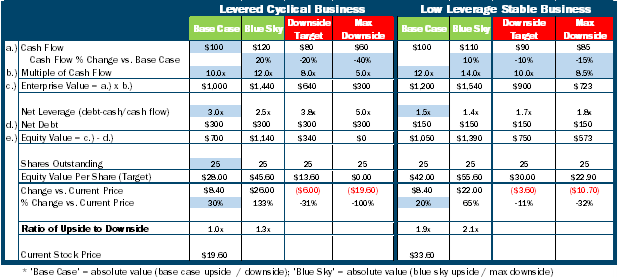
Below is an example of our thinking. Here we detail two businesses, both of which generate $100/year of cash flow and have 25 shares outstanding. The company to the left maintains a leverage ratio of 3x (debt/cash flow) and operates in a cyclical industry. In a normal cycle, cash flows can rise or fall ~20%, but when a deep recession hits, cash flow can fall 40%. Currently the stock is trading at a 30% discount to the base case scenario of $28/share assuming a 10x multiple on cash flow. The company on the right maintains a much lower leverage ratio of 1.5x and operates in a stable end market that isn’t dependent upon the economic cycle. Stable company cash flows can rise or fall 10% in any given year, but when inflation rises materially and margins compress, cash flows can fall 15%. Today, the stable business trades at a 20% discount to the base case scenario of $42/share assuming a 12x multiple of cash flow (the market normally ascribes a higher valuation to more predictable businesses).
What business is the better use of capital? At first glance, the cyclical business looks more appealing because one would pay a lower multiple (10x vs 12x for the stable business) for more upside (30% vs 20% for the stable business). If fundamentals approach the “blue sky” scenario, an investor could make 133% on their investment in the cyclical business, far more than a 65% gain in the stable business.
The flaw in this logic is ignoring the downside risks of the two businesses. When framed against what one could lose, stable business appears more compelling even if we pay a higher multiple. For example, the levered company’s equity could be worthless in the “max downside” scenario (cash flow -40% and valuation falls to 5x) whereas the stable businesses equity could decline 32% (cash flow -15% and valuation falls to 8.5x), a material decline but far from permanent capital destruction. In the two extreme scenarios (blue sky vs max downside) an investor is getting paid $1.3 for every dollar of risk in the cyclical business but $2.10 for every dollar of risk in the stable business. Framing the upside relative to the downside, is how we think about allocating capital every day.
Often, we are asked how we define risk. While some investors associate risk with volatility, we don’t. We believe volatility is a component of risk, but we don’t view these concepts as interchangeable given investors will generally favor earning the same level of return produced with less volatility, all else equal.
We view risk on several levels. First, we look at company-specific risks, assessing the possibility of permanent capital loss. But while we want to focus on stock picking, we are also mindful that we need to deliver a product that’s relevant to our shareholders’ broader investment strategy. That’s why we also view risk at a portfolio level. For example, an investor likely owns Heartland Mid Cap Value because they want mid-value exposure, so we must consider not only the risk of underperforming, but also the risk of generating performance that’s out of sync with the asset class, as an investor uses our strategy to fulfill a specific piece of their asset allocation process.
It may seem counter-intuitive, but investors who refer to themselves as “stock pickers” while ignoring sectors and benchmarks are more likely to reduce the impact of their stock picking. For instance, if managers focus exclusively on security selection such that their sector weightings significantly deviate from the benchmark, they could be inadvertently making top-down macro and/or risk factor calls without realizing it. And those unintended sector bets could be what’s driving their performance rather than security selection.
To avoid falling into this trap, we invest with guardrails that seek to ensure the active risk we are taking is asset-specific security selection:
While we do not maintain sector-neutral positioning, our over and underweight decisions are more than just a function of our bottom-up work in a particular sector. For example, we’re willing to maintain or increase an overweight position to a particular sector if that exposure is offsetting risk created by other underweights. It’s not uncommon for an overweight sector to be a negative contributor to active risk. In other words, an overweight is dampening risk not acting as a magnifier. Conversely, if we’re finding a plethora of attractive cyclical ideas across sectors, we may be underweight areas with wider ranges of possible outcomes as is often the case in capital intensive cyclical sectors like Energy or Real Estate.
Our process may not follow traditional thinking, but it’s a reflection of our ultimate desire to let stock selection — which is what we think we do best — ultimately drive the performance of our strategy. At the same time, we are self-aware enough to know that we can’t predict the direction of the equity market or any given stock with absolute certainty. That’s why we prepare for the risks and opportunities that may present themselves, regardless of the circumstances.
©2026 Heartland Advisors | 790 N. Water Street, Suite 1200, Milwaukee, WI 53202 | Business Office: 414-347-7777 | Financial Professionals: 888-505-5180 | Individual Investors: 800-432-7856
Past performance does not guarantee future results.
Investing involves risk, including the potential loss of principal.
There is no guarantee that a particular investment strategy will be successful.
Value investments are subject to the risk that their intrinsic value may not be recognized by the broad market.
The statements and opinions expressed in the articles or appearances are those of the presenter. Any discussion of investments and investment strategies represents the presenters' views as of the date created and are subject to change without notice. The opinions expressed are for general information only and are not intended to provide specific advice or recommendations for any individual. Any forecasts may not prove to be true.
Economic predictions are based on estimates and are subject to change.
CFA® is a registered trademark owned by the CFA Institute.
Heartland’s investing glossary provides definitions for several terms used on this page.