Second Quarter Market Discussion
It has been challenging to reflect on how the market has behaved lately because so far this year, every month has felt different. The second quarter was no exception.
April was a difficult period in which the Russell Midcap® Value Index slumped more than 5%, with our portfolio holdings performing very differently from one another. In May, stocks bounced back and exhibited some of the same ‘risk-on’ characteristics fueled by the artificial intelligence (AI) craze that drove the market last year. Not surprisingly, our Strategy lagged the benchmark that month. This was followed by a more reactive and fearful market in June, when investors became more fearful of potential risks ahead, a backdrop against which we began to outperform.
What are some of the risks that investors began to ponder? For starters, signs emerged that demand destruction is spreading throughout the economy. What began with concerns over the health of lower- and middle-class consumers has expanded to worries over wealthier households. In recent months, luxury retailers such as Burberry and LVMH Group reported disappointing sales and profits as demand for high-end goods from handbags to champagne have slumped.
At the same time, industrial demand remains under pressure. Manufacturing shrunk in May, marking the 19th month of contracting activity out of the past 20, according to the ISM Manufacturing PMI®. The Purchasing Managers’ Index (“PMI”) appears to be bottoming out this year, as forecasts indicate manufacturing activity could begin to grow in the second half of this year. However, while manufacturing earnings have historically tracked movements in PMI, that has not been the case recently (see chart). Therefore, even if the PMI rebounds later this year, manufacturers may not see a corresponding benefit in their fundamentals.
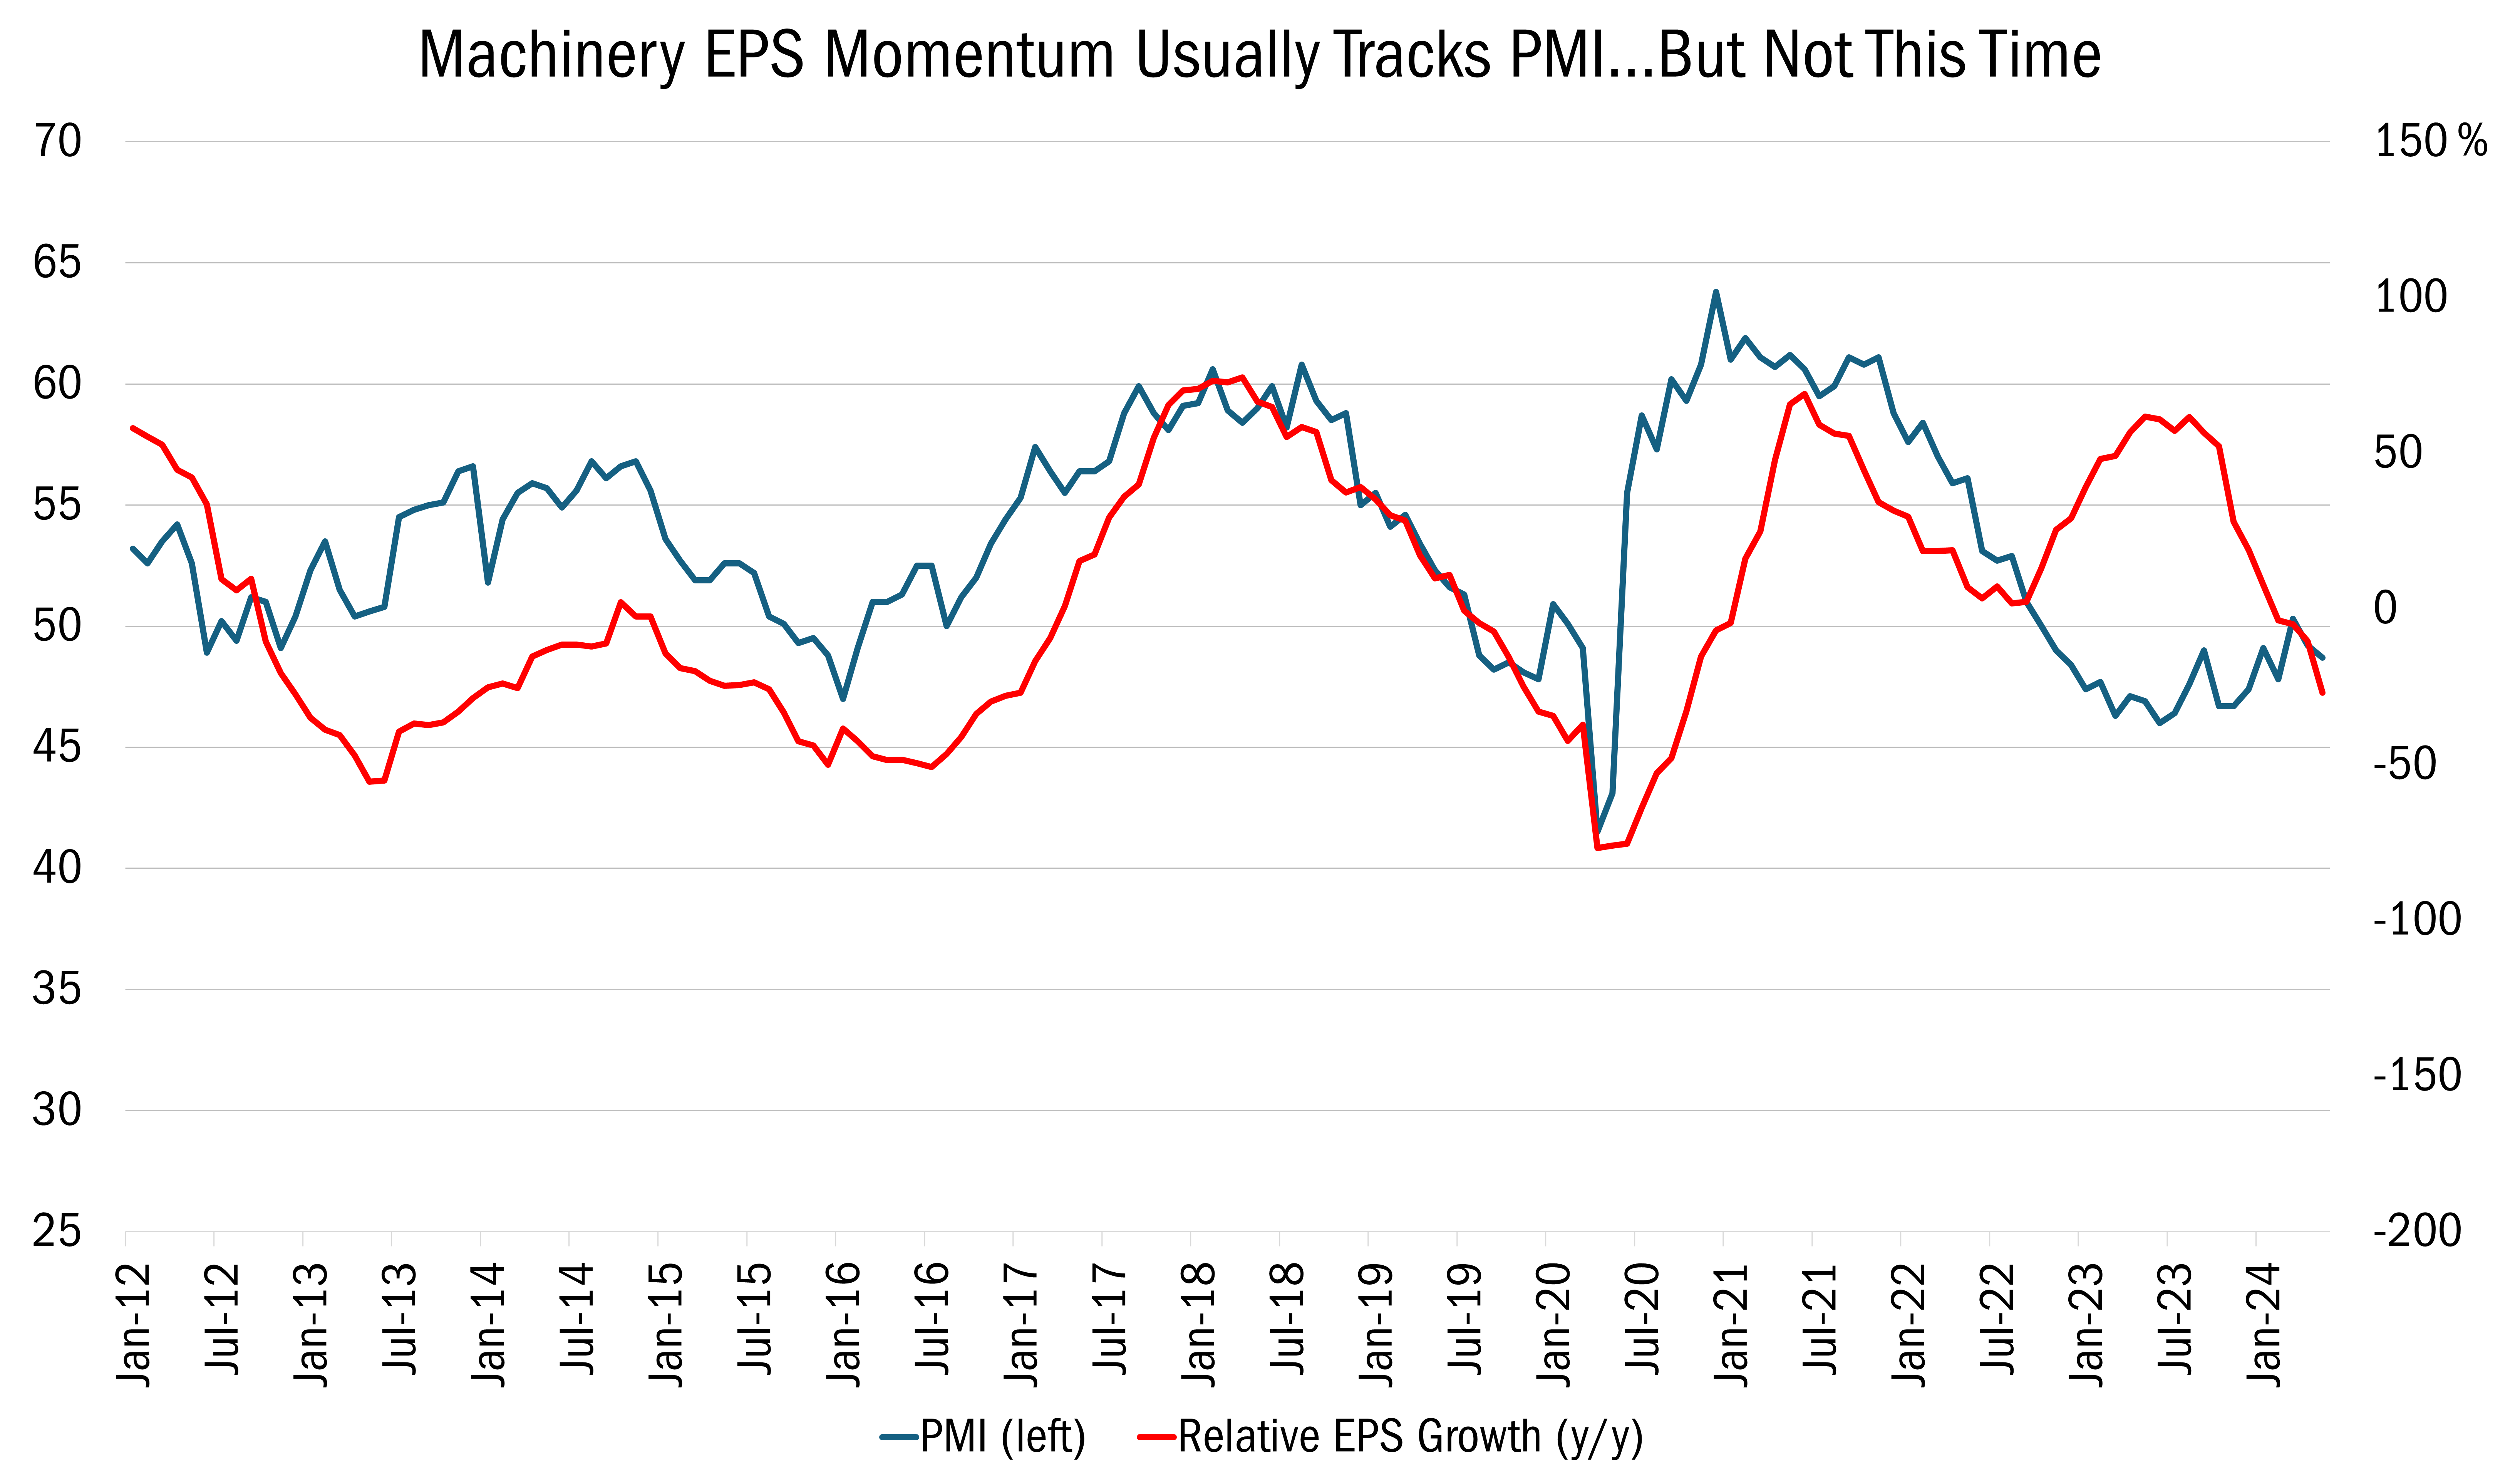
Source: Baird and FactSet Research Systems, Inc., Monthly data from January 1985 to May 2024. This chart represents US Truck/Construction/Farm Machinery Index relative to S&P 500 Index. All indices are unmanaged. It is not possible to invest directly in an index. Past performance does not guarantee future results.
Where does that leave us? While we understand the need to be mindful of the backdrop in which we are investing, we remain focused on stock-specific risks and rewards, not top-down forecasts of the economy. Our decision-making has always been — and will remain — guided by bottoms-up security selection based on our 10 Principles of Value Investing™, which seeks out well-managed, financially strong businesses that can grow cash flow and value over time.
Attribution Analysis
The Mid Cap Value Fund fell 4.03% in the second quarter, while the Russell Midcap® Value Index was down 3.40%. Underperformance was partially driven by the negative selection effect across seven sectors, led by Consumer Discretionary and Utilities.
This was equally attributable to the stocks we own as well as those we’ve elected to avoid, including speculative bets on AI. We refuse to chase speculative companies or overpay for admittedly good businesses that trade at record high multiples on cyclically elevated margins. Both types of stocks have ample downside risk if any prevailing assumption about the environment changes.
Portfolio Activity
As we have mentioned before, we intentionally hold high-quality companies trading below intrinsic value (“quality value”) and deeply discounted companies that have produced poor economic returns over time (“deep value”) because it is difficult to know when one style will outperform the other.
Within deep value, however, we don’t just look for mediocre companies that are statistically cheap. Rather, deep value businesses are only purchased after identifying an internal change agent that could help close the gap between the current share price and the intrinsic value of the company based on successful execution of an improvement playbook. In other words, we are looking for deeply discounted companies that are poised to help themselves.
Here are examples of deep value stocks that represent this approach, all of which have strong self-help strategies:

Financials. In the second quarter, we started a new position in Fidelity Information Services, Inc. (FIS). FIS is one of three major suppliers of core processing software and services utilized by banks, capital market participants, and corporations. Whenever you log into your mobile phone banking app, pay a bill, or transfer money, there is a decent chance that FIS enables that transaction. Given the contractual nature of its business, 80% of the company’s revenues are recurring providing better revenue visibility and less profit volatility than sector peers.
FIS is a classic self-help story about strategic course correction and capital allocation. The company’s prior management team took a wrong turn by following competitor Fiserv into the merchant acquiring industry — the intermediaries that stand between credit card networks like Visa or Mastercard and card issuers like Capital One or Citi — when it overpaid for Worldpay in 2019. Rather than boosting FIS’s growth as planned, the acquisition was a distraction as software startups began taking share from incumbents, including Worldpay.
Starting in 2022, new CEO Stephanie Ferris began to change course, selling a majority stake in Worldpay and using the proceeds to pay down debt, taking leverage down from more than 4 times Net Debt to EBITDA to below 2 times. At the same time, she refocused the business by shifting sales incentives away from new client wins and toward selling additional services to existing customers to make the business stickier and more profitable.
We initiated a position in FIS because we believe the fruits of this self-help strategy have yet to fully ripen. We expect accelerating revenue growth through improved sales incentives and increased technology needs for banks. Meanwhile, margin expansion should be driven by cross selling additional services, streamlining costs, and eliminating the Worldpay distractions.
The company is trading at 11 times next-12-month Enterprise Value to EBITDA (after backing out the value of FIS’s minority Worldpay stake), while competitors Fiserv and Jack Henry & Associates trade at 11.7 and 16.2 times EV/EBITDA, respectively. FIS also trades near parity with the Russell Midcap® Value Index even though it has traded at around a 10% premium to the benchmark for the past two decades.

Industrials. Stericycle, Inc. (SRCL), a leading medical waste disposal and compliance company in the country, is an example where self-help has come to fruition.
After undertaking a variety of self-help strategies — including divesting 12 non-core operations over roughly six years to focus on its core medical waste disposal and document destruction businesses while reducing debt — Stericycle agreed to be acquired by Waste Management for $62 per share, valuing the deal at $7.2 billion.
This is SRCL’s reward for changing its game plan, turning what was a company that sought growth through aggressive M&A into a business focused on organic growth while seeking to optimize margins, capital allocation, and returns on investment. When we wrote about this stock a year ago, we referred to this as a metamorphosis from ‘holding company’ to ‘operating company’ with a better chance for rewarding shareholders. When Waste Management announced the acquisition, Stericycle was well into the process of implementing plans to improve revenue quality (through steps such as implementing better pipeline management processes) and operating efficiency (through modernization and innovation).
Before the deal, we had assigned Stericycle a price target of $63 a share, which was near the takeout price. Waste Management seemed to agree with what we concluded: SRCL had been trading at a discount to its own history and to its waste industry peers that operate bond-like business models.
Industrials. J.B. Hunt Transportation Services, Inc. (JBHT) was our Strategy’s worst performer during the quarter, down almost 19%. But this is another example where self-help could set the stage to benefit from potential secular tailwinds.
J.B. Hunt is a leading intermodal shipping company. Customers hire Hunt to move freight using a variety of transportation modes to reduce cost and fuel consumption. This “agnostic” approach stands in contrast to most competitors who utilize a single mode of transportation. The company missed first quarter expectations, causing the stock to sell off in April. The truck load (TL) market is in a deep recession due to weak demand and too much capacity. Because TL is a substitute market for intermodal (normally a much-less-efficient substitute at that), the irrationally priced spot market, which tracks the cost to move single shipments by truck at current prices, has cut Hunt’s intermodal margins to their lowest levels in more than 20 years while forcing management to walk away from some contracted business as renewals occur.
With profit expectations down around 25% from peak, Hunt seems to be underearning. Management is planning to increase Hunt’s intermodal capacity 40% by the end of 2025 versus 2021 levels, improving asset density and efficiency, while driving further market share gains. In recognition of the soft freight market, management has elected to moderate capital spending with the goal of improving asset utilization. Importantly, we believe that a cyclical recovery is only the beginning of the story, with the company uniquely poised to structurally gain market share for the rest of the decade driven by a cost advantage relative to TL.
In the meantime, JBHT trades at 9.6 times consensus next-12-month Enterprise Value to EBITDA, representing a 30% discount to the Industrials sector, even though Hunt normally trades at parity or a slight premium when economic growth is accelerating. The company’s balance sheet is in solid shape with a leverage ratio of less than 1X. We believe Hunt can fund network investments through a recession using internal cash generation without stressing the company’s balance sheet.
Outlook
While we were disappointed to lag our benchmark over the past two quarters, we do not measure success or failure in quarters and we are confident in how we are positioned, regardless of what direction the market or economy takes in the coming months. We believe a number of our companies are inching toward an inflection point, hinting at better days ahead. Meanwhile, many other holdings have just hit that inflection point when it comes to fundamentals or relative performance, with us believing that they are in the early innings of seeing their self-help strategies rewarded in the form of relative outperformance. As always, we are willing to be patient when warranted. Guided by our 10 Principles of Value Investing™, we remain focused on what we can control. This includes finding quality businesses with attractive valuations that are led by capable management teams that can engineer an internal catalyst to drive appreciation.