Heartland Advisors

Heartland Small Cap Value Plus Strategy 2Q24 Portfolio Manager Commentary

Executive Summary

  • In a difficult quarter for small-caps, we are hunting for green shoots.
  • The Strategy has been actively focusing on undervalued companies poised to see a potential uptick in earnings, once demand dynamics improve and the effects of self-help strategies kick in. 
  • Companies with strong capital allocation policies including dividend growth and active stock buybacks should stand out as the market eventually begins to broaden out.  

Second Quarter Market Discussion

In one respect, this was another challenging quarter for small-cap investors, as the Russell 2000® Index fell 3.28% while the S&P 500 Index gained 4.28%. But it was also a market in which some green shoots began to sprout up, giving disciplined bargain hunters, like us, hope that the markets can and will eventually broaden out.

Though investors’ infatuation with mega cap tech continues, we spent the quarter looking for budding opportunities. Specifically, we are searching for companies with stabilizing year-over-year sales that should soon see an uptick in earnings, either because pricing dynamics are starting to move their way or because the self-help strategies they’ve implemented to improve operational or strategic performance are gaining traction. We are looking across a variety of industries, though more of these prospects are likely to be found in parts of the market that benefit in the early stages of a recovery, such as Industrials and Consumer Discretionary companies. Regardless of the type of business, the ultimate goal is to identify management teams with strong capital allocation policies as a foundation for delivering shareholder returns.

Our search for such stocks is taking place entirely from a bottoms-up perspective, which is how we construct our portfolio. From a top-down point of view, though, there are also signs of promise, especially as the earnings outlook is coming into sharper focus. 

Heading into the year, expectations were that profits for large caps would begin to wane, potentially redirecting investor attention to the smaller end of the market capitalization spectrum. In the first quarter, however, forecasts for small-cap earnings declined while S&P 500 profit estimates improved. Nevertheless, a reversal of fortune is still expected in the latter half of this year — especially once the Magnificent 7 tech stocks are removed from the equation (see chart below).


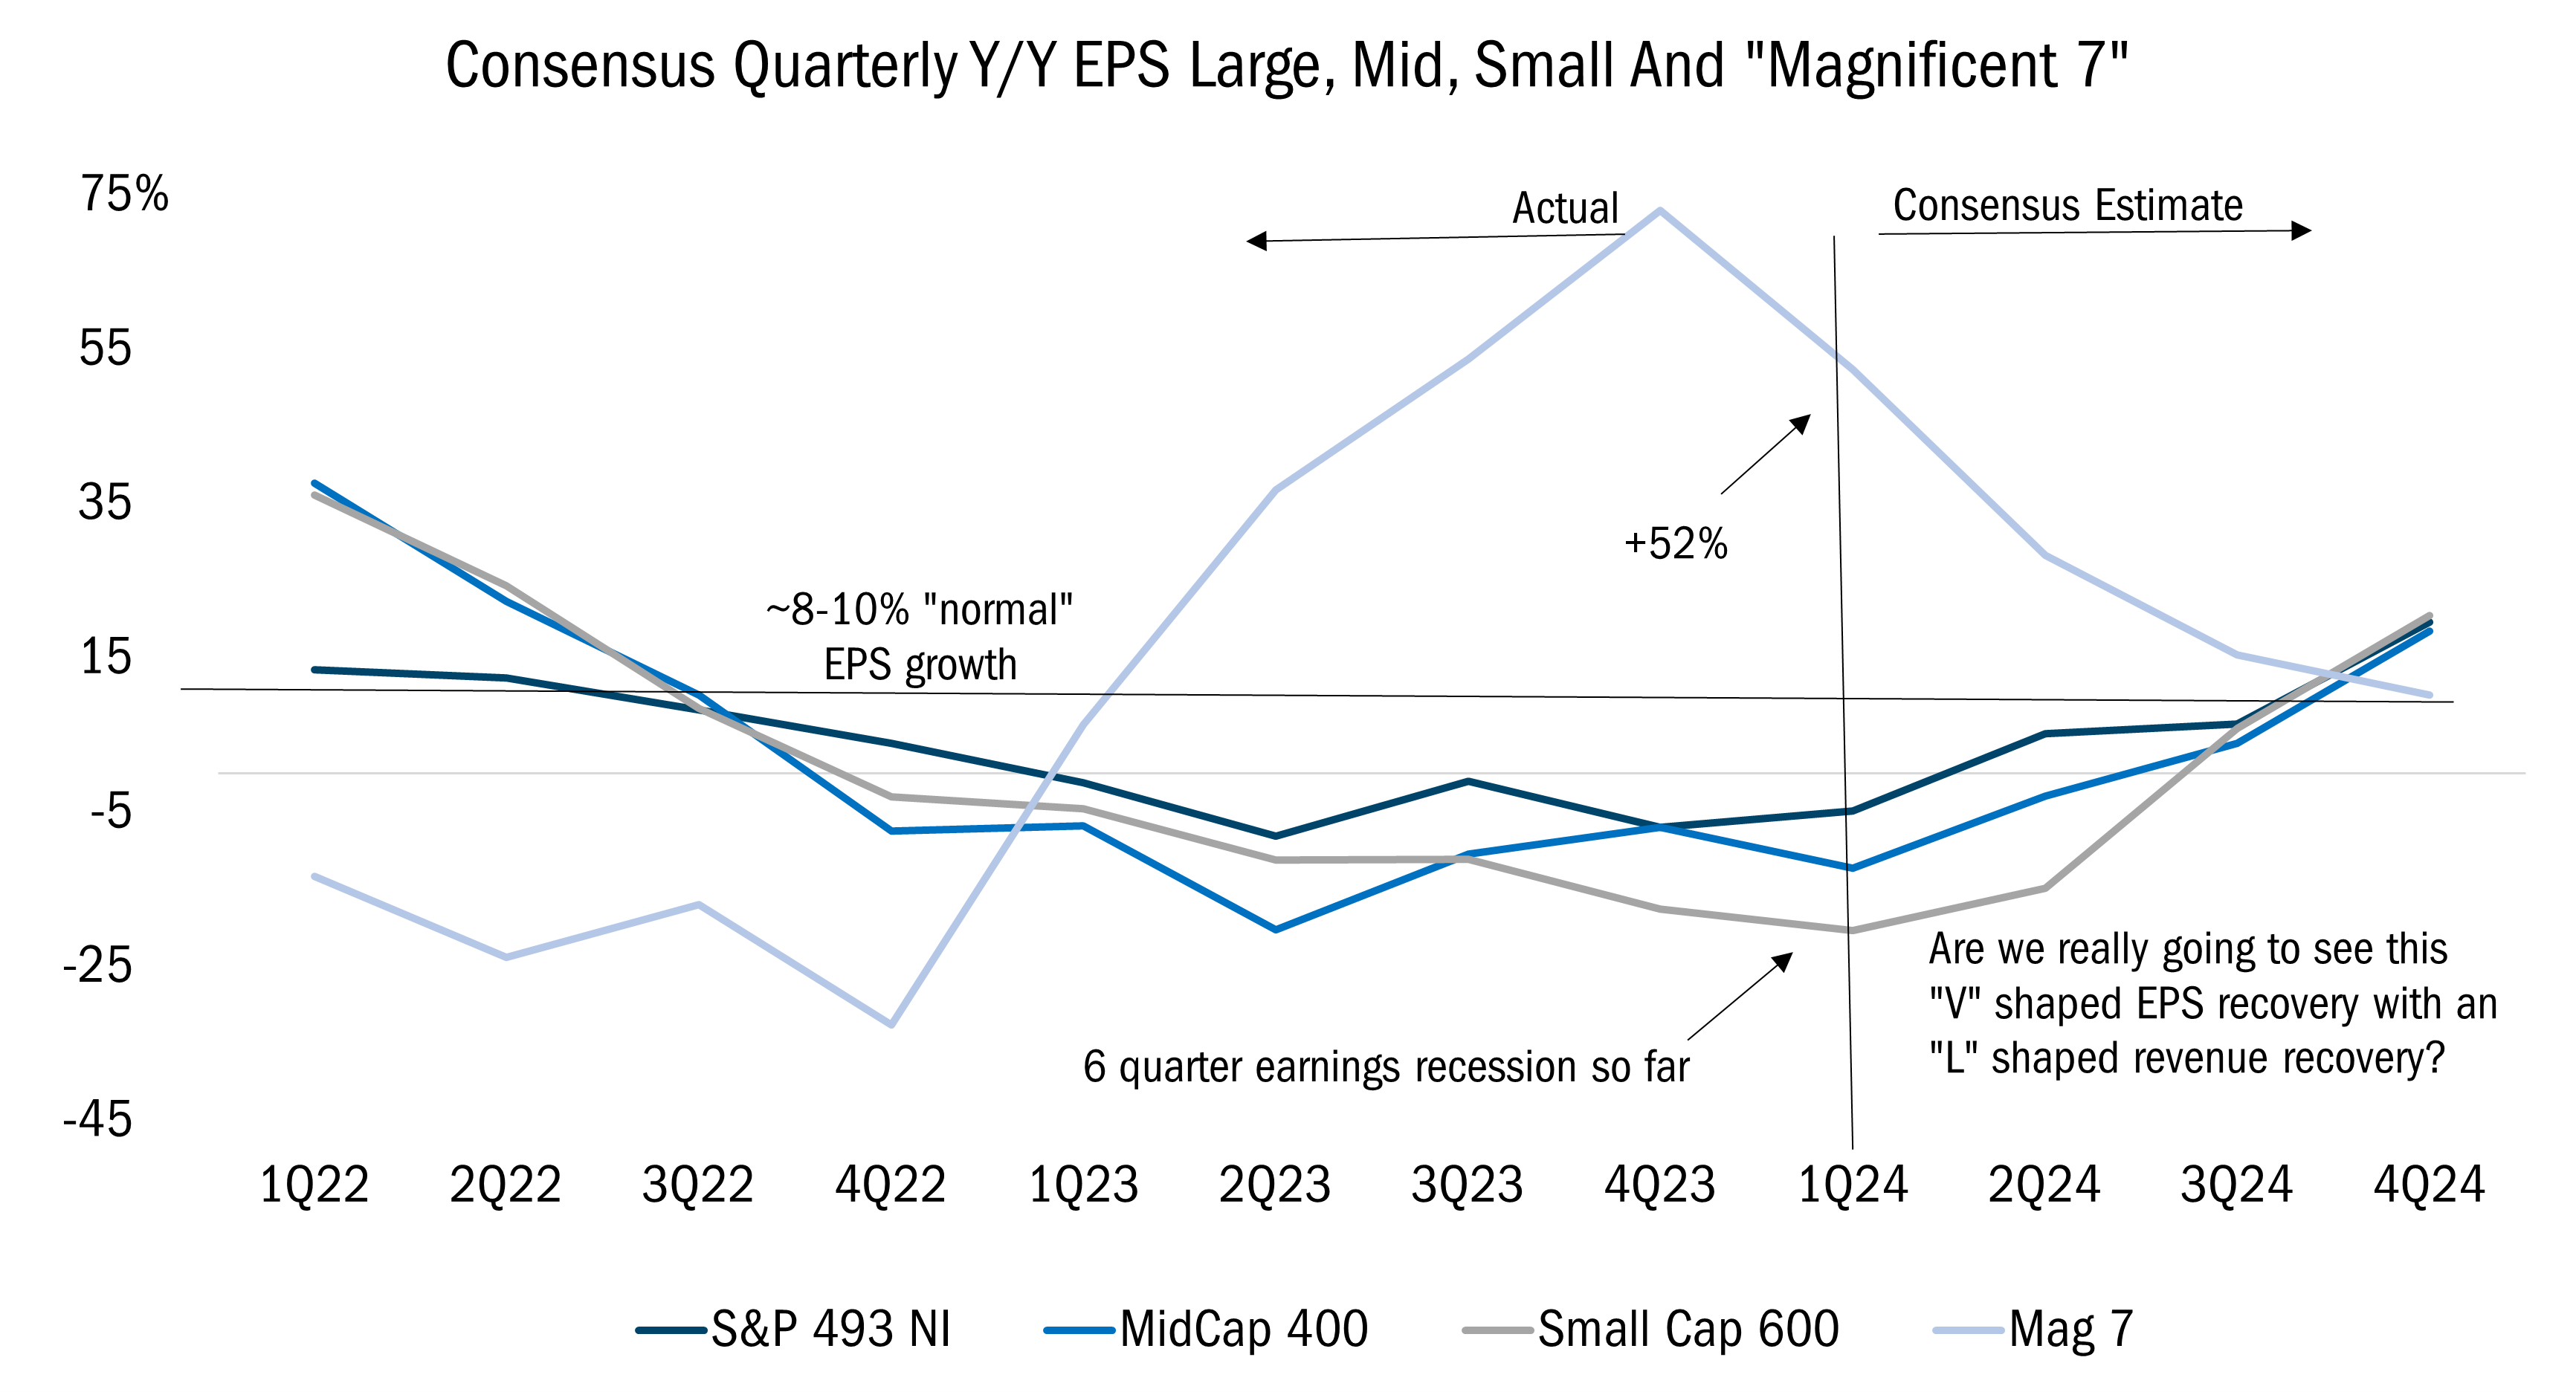
Source: Raymond James research, FactSet Research Systems, Inc. Quarterly data from 1Q22 to 4Q24. This chart represents the Consensus Quarterly Y/Y EPS Large, Mid, Small, and "Magnificent 7" by reflecting the S&P 500, S&P Midcap 400, S&P Small cap 600 - utilizing actual results from 1Q22-1Q24, consensus estimates 2Q24-4Q24. Only Nuance is we have separated S&P 500 into the "Mag 7" and everything else, which we call S&P 493. All indices are unmanaged. It is not possible to invest in an index. Past performance does not guarantee future results.

This gives us confidence that a rebound in small-cap performance, based on the fundamentals, is possible. If that occurs, the improving backdrop could provide a decent dose of operating leverage to those ‘green shoots’ we are focusing on.

Attribution Analysis & Portfolio Activity

In the second quarter, the Value Plus Strategy was down 7.34%, trailing the Russell 2000® Value Index, which fell 3.64%. Stock selection, particularly in the Consumer Discretionary, Financials, and Energy sectors, contributed to the underperformance. However, selectivity helped the Strategy outperform the benchmark in the Information Technology, Health Care, and Utilities sectors. 

We initiated positions in several new holdings while exiting or reducing our exposure in a handful of others. We believe our portfolio is well represented by secular winners that exhibit defensive attributes. We are trying to balance this out by adding exposure to higher-quality companies with more cyclical characteristics trading at trough multiples while at trough earnings. If management knows how to allocate capital effectively and self-help is sprinkled in, these are businesses where even modest demand growth could lead to a material improvement in their operating performance.

This effort has led to a slight uptick in turnover, but we remain steadfast in focusing on well-managed small-cap companies with low leverage, solid balance sheets, and a strong capital allocation process in place, which are part of our 10 Principles of Value Investing™. We also favor companies deploying self-help strategies to improve their competitive standing and profitability. Finally, we gravitate towards companies and management teams providing signals (buybacks and insider buying) that shares are undervalued. More than 85% of our holdings are engaged in active buybacks, which is the highest percentage in recent memory, and many holdings had insider buying during the quarter.

These are companies like Kennametal, Inc. (KMT), the manufacturer of industrial cutting tools and components that we mentioned in our Q1 commentary. The company is emerging from trough demand and has seen EBITDA contract on a year-over-year basis in 5 of the last 7 quarters. But the company has been undergoing extensive self-help during the past 5 years, taking out $200 million in structural costs, cutting its headcount by 20%, and closing 6 plants as part of an extensive restructuring. The heavy lifting/investment phase seems to now be in the rearview mirror. While demand has not yet inflected higher, sales are stabilizing. If Kennametal sees even a slight pickup in demand in its end markets, that could provide an immediate and robust boost to its operating margins. Furthering our confidence, KMT’s newly appointed CEO purchased shares in the quarter and the company is active on its buyback program.

We see a similar opportunity in Science Applications International Corp. (SAIC), which offers a range of IT services to its customers.

SAIC has faced recent challenges with lower-than-average government contract renewals and lower demand for their IT services, prompting the appointment of new management to address business development concerns. We purchased shares of SAIC in the second quarter on the premise that the new management team, led by a CEO previously with Microsoft, will be able to succeed in two key self-help efforts: increasing the volume of SAIC bids and improving the firm’s below-average industry "recompete rates," which consist of rebidding on previously awarded expiring government contracts that are typically 5 years in length. 

These efforts, coupled with internally focused capital allocation strategies that include dividend growth and active share buybacks, are likely to drive price appreciation for the stock. In the meantime, SAIC shares trade at a modest 13 times forecast earnings with a strong 8% free cash flow/enterprise value yield. Additionally, SAIC’s newly appointed CEO and CFO purchased shares during the quarter — suggesting to us the management team is confident in future prospects at SAIC.

Outlook

While mega-cap stocks continued to be the focus of investor interest, that won’t always be the case. There are fundamental reasons to believe the market will eventually broaden out, and it is our job to identify undervalued, overlooked companies that are likely to benefit when that turns takes place. We have been looking for these potential green shoots and are encouraged by some of the opportunities we are seeing. Until those budding opportunities fully bloom, though, we are comforted by the fact that the companies we own are allocating capital wisely and taking steps to improve their competitive and operational standing. That’s why we are confident our disciplined approach — focusing on companies with low trading multiples, strong free cash flow, solid balance sheets, and sound capital allocation as outlined in our 10 Principles of Value Investing™ — will guide us well as the market transitions.
    

Please wait while we gather your results.

Portfolio Management Team

Heartland Advisors Value Investing Portfolio Manager Andrew Fleming

Andrew J. Fleming

Director of Research, Vice President, and Portfolio Manager

Composite Returns*

6/30/2024

Scroll over to view complete data

Since Inception (%)10-Year (%)5-Year (%)3-Year (%)1-Year (%)YTD (%)QTD (%)
Small Cap Value Plus Composite (Net of Advisory Fees)**6.784.366.87-2.55-3.97-5.60-7.22
Small Cap Value Plus Composite (Net of Bundled Fees)5.993.846.35-3.03-4.45-5.84-7.34
Russell 2000® Value6.916.237.07-0.5310.90-0.85-3.64

Source: FactSet Research Systems Inc., Russell Investment Group, and Heartland Advisors, Inc.
*Yearly and quarterly returns are not annualized. The Strategy's inception date is 11/30/2007. 
**Shown as supplemental information. 

The US Dollar is the currency used to express performance. Returns are presented net of advisory fees and net of bundled fees and include the reinvestment of all income. The returns net of bundled fees were calculated by subtracting the highest applicable sponsor portion of the separately managed wrap account fee from the net of advisor fees return.

Small Cap Value Plus Strategy Quick Links

Factsheet


Download PDF

Commentary


View Commentary

Attribution & Contribution Reports

Sign In

Holdings


Sign In


Email Sign Up


©2024 Heartland Advisors | 790 N. Water Street, Suite 1200, Milwaukee, WI 53202 | Business Office: 414-347-7777 | Financial Professionals: 888-505-5180 | Individual Investors: 800-432-7856

Past performance does not guarantee future results.

The Small Cap Value Plus Strategy primarily invests in companies that have a market capitalization consistent with the capitalization range of the Russell 2000 Value Index, with a majority of its assets invested in companies that pay dividends. The Strategy intends to capture the long-term appreciation of small-caps, while minimizing the volatility of returns inherent in the small-cap market.

The Small Cap Value Plus Strategy invests in small companies selected on a value basis. Such securities generally are more volatile and less liquid than those of larger companies.

Value investments are subject to the risk that their intrinsic value may not be recognized by the broad market.

Heartland Advisors, Inc. (the "Firm") claims compliance with the Global Investment Performance Standards (GIPS®). The Firm is a wholly owned subsidiary of Heartland Holdings, Inc., and is registered with the Securities and Exchange Commission. For a complete list and description of Heartland Advisors composites and/or a presentation that adheres to the GIPS® standards, contact the Institutional Sales Team at Heartland Advisors, Inc. at the address listed below.

As of 6/30/2024, Kennametal, Inc. (KMT) and Science Applications International Corp. (SAIC), represented 2.21% and 1.41% of the Small Cap Value Plus Composite’s net assets, respectively. 

The future performance of any specific investment or strategy (including the investments discussed above) should not be assumed to be profitable or equal to past results. The performance of the holdings discussed above may have been the result of unique market circumstances that are no longer relevant. The holdings identified above do not represent all of the securities purchased, sold or recommended for the Advisor’s clients.

Statements regarding securities are not recommendations to buy or sell. 

Portfolio holdings are subject to change. Current and future holdings are subject to risk.

In certain cases, dividends and earnings are reinvested.

GIPS® is a registered trademark of CFA Institute. CFA Institute does not endorse or promote this organization, nor does it warrant the accuracy or quality of the content contained herein.

Separately managed accounts and related investment advisory services are provided by Heartland Advisors, Inc., a federally registered investment advisor. ALPS Distributors, Inc., is not affiliated with Heartland Advisors, Inc.

The statements and opinions expressed in this article are those of the presenter(s). Any discussion of investments and investment strategies represents the presenters’ views as of the date created and are subject to change without notice. The opinions expressed are for general information only and are not intended to provide specific advice or recommendations for any individual. The specific securities discussed, which are intended to illustrate the advisor’s investment style, do not represent all of the securities purchased, sold, or recommended by the advisor for client accounts, and the reader should not assume that an investment in these securities was or would be profitable in the future. Certain security valuations and forward estimates are based on Heartland Advisors’ calculations. Any forecasts may not prove to be true. 

Economic predictions are based on estimates and are subject to change.

There is no guarantee that a particular investment strategy will be successful.

Sector and Industry classifications are sourced from GICS®.The Global Industry Classification Standard (GICS®) is the exclusive intellectual property of MSCI Inc. (MSCI) and S&P Global Market Intelligence (“S&P”).  Neither MSCI, S&P, their affiliates, nor any of their third party providers (“GICS Parties”) makes any representations or warranties, express or implied, with respect to GICS or the results to be obtained by the use thereof, and expressly disclaim all warranties, including warranties of accuracy, completeness, merchantability and fitness for a particular purpose.  The GICS Parties shall not have any liability for any direct, indirect, special, punitive, consequential or any other damages (including lost profits) even if notified of such damages.

Heartland Advisors defines market cap ranges by the following indices: micro-cap by the Russell Microcap®, small-cap by the Russell 2000®, mid-cap by the Russell Midcap®, large-cap by the Russell Top 200®.

Because of ongoing market volatility, performance may be subject to substantial short-term changes.

Dividends are not guaranteed and a company’s future ability to pay dividends may be limited. A company currently paying dividends may cease paying dividends at any time.

There is no assurance that dividend-paying stocks will mitigate volatility.

CFA® is a registered trademark owned by the CFA Institute.

Russell Investment Group is the source and owner of the trademarks, service marks and copyrights related to the Russell Indices. Russell® is a trademark of the Frank Russell Investment Group.

Data sourced from FactSet: Copyright 2024 FactSet Research Systems Inc., FactSet Fundamentals. All rights reserved.

Heartland’s investing glossary provides definitions for several terms used on this page.

Artificial intelligence (AI) is intelligence—perceiving, synthesizing, and inferring information—demonstrated by computers, as opposed to intelligence displayed by humans or by other animals. Dividend Yield is a ratio that shows how much a company pays out in dividends each year relative to its share price.  Earnings Before Interest, Taxes, Depreciation and Amortization (EBITDA) measures a company’s financial performance. It is used to analyze and compare profitability between companies and industries because it eliminates the effects of financing and accounting decisions. Free Cash Flow is the amount of cash a company has after expenses, debt service, capital expenditures, and dividends. The higher the free cash flow, the stronger the company’s balance sheet. Leverage is the amount of debt used to finance a firm's assets. A firm with significantly more debt than equity is considered to be highly leveraged. Operating Leverage is a measurement of the degree to which a firm or project incurs a combination of fixed and variable costs. A business that makes sales providing a very high gross margin and fewer fixed costs and variable costs is considered to have high leverage. The higher the degree of operating leverage, the greater the magnitude of changes in sales to potential profits. Russell Investment Group is the source and owner of the trademarks, service marks and copyrights related to the Russell Indices. Russell® is a trademark of the Russell Investment Group.  Russell 2000® Index includes the 2000 firms from the Russell 3000® Index with the smallest market capitalizations. All indices are unmanaged. It is not possible to invest directly in an index. Russell 2000® Value Index measures the performance of those Russell 2000® companies with lower price/book ratios and lower forecasted growth characteristics. All indices are unmanaged. It is not possible to invest directly in an index. S&P 500 Index is an index of 500 U.S. stocks chosen for market size, liquidity and industry group representation and is a widely used U.S. equity benchmark. All indices are unmanaged. It is not possible to invest directly in an index. 10 Principles of Value Investing™ consist of the following criteria for selecting securities: (1) catalyst for recognition; (2) low price in relation to earnings; (3) low price in relation to cash flow; (4) low price in relation to book value; (5) financial soundness; (6) positive earnings dynamics; (7) sound business strategy; (8) capable management and insider ownership; (9) value of company; and (10) positive technical analysis.

top