Heartland Advisors

Heartland Small Cap Value Strategy 1Q25 Portfolio Manager Commentary

 Executive Summary

  • The Heartland Small Cap Value Strategy outperformed its benchmark for the quarter and also the past 1, 3 and 5 years. 
  • The macroeconomic outlook may be unclear, but focusing on the micro reveals how much value there is in this market. 
  • Identifying opportunities amid widespread fear is what active management is all about, and stock selection continues to drive our results. 

"Behind every stock there is a company. Find out what it’s doing.”
— Peter Lynch  

Sometimes, it’s almost impossible, even for long-term minded investors, to completely ignore the noise. The first quarter was one of those markets. 

Nobody — not large institutional investors, advisors, economists, or individuals — really knew what was coming next in the flurry of policy shifts ranging from tariffs to spending cuts at the start of the year. With businesses and consumers expecting more fiscal shoes to drop, many held off making big decisions, reducing the pace of new hiring, investments, and spending in the quarter, leading to a selloff. As you’d expect, the corresponding flight to safety hit small stocks harder, with the Russell 2000® Index down around 9.5% in the first quarter, compared with the 4.3% decline for the blue chip S&P 500 Index. 

There is something, however, that successful value managers know when it comes to navigating times like this. When the macroeconomic picture begins to blur, it often makes sense to focus on the micro. That’s how some of the smartest investors in history, such as Warren Buffett and Peter Lynch, found their success. Lynch famously noted that in every era, there has been an existential fear about the economy, geopolitics, or fiscal policy that seemed as if it might derail the market’s long-term upward trajectory. The mistake that many make is letting those top-down worries drive them out of equities rather than concentrating on the opportunities presenting themselves from a bottoms-up perspective. 

At the end of March, bearishness tracked by the American Association of Individual Investors climbed to a reading of 52.2, a level that’s only been reached a few times in recent memory. This amount of fear was last seen in the global financial crisis in 2008-2009 and the recession of 1990.
 

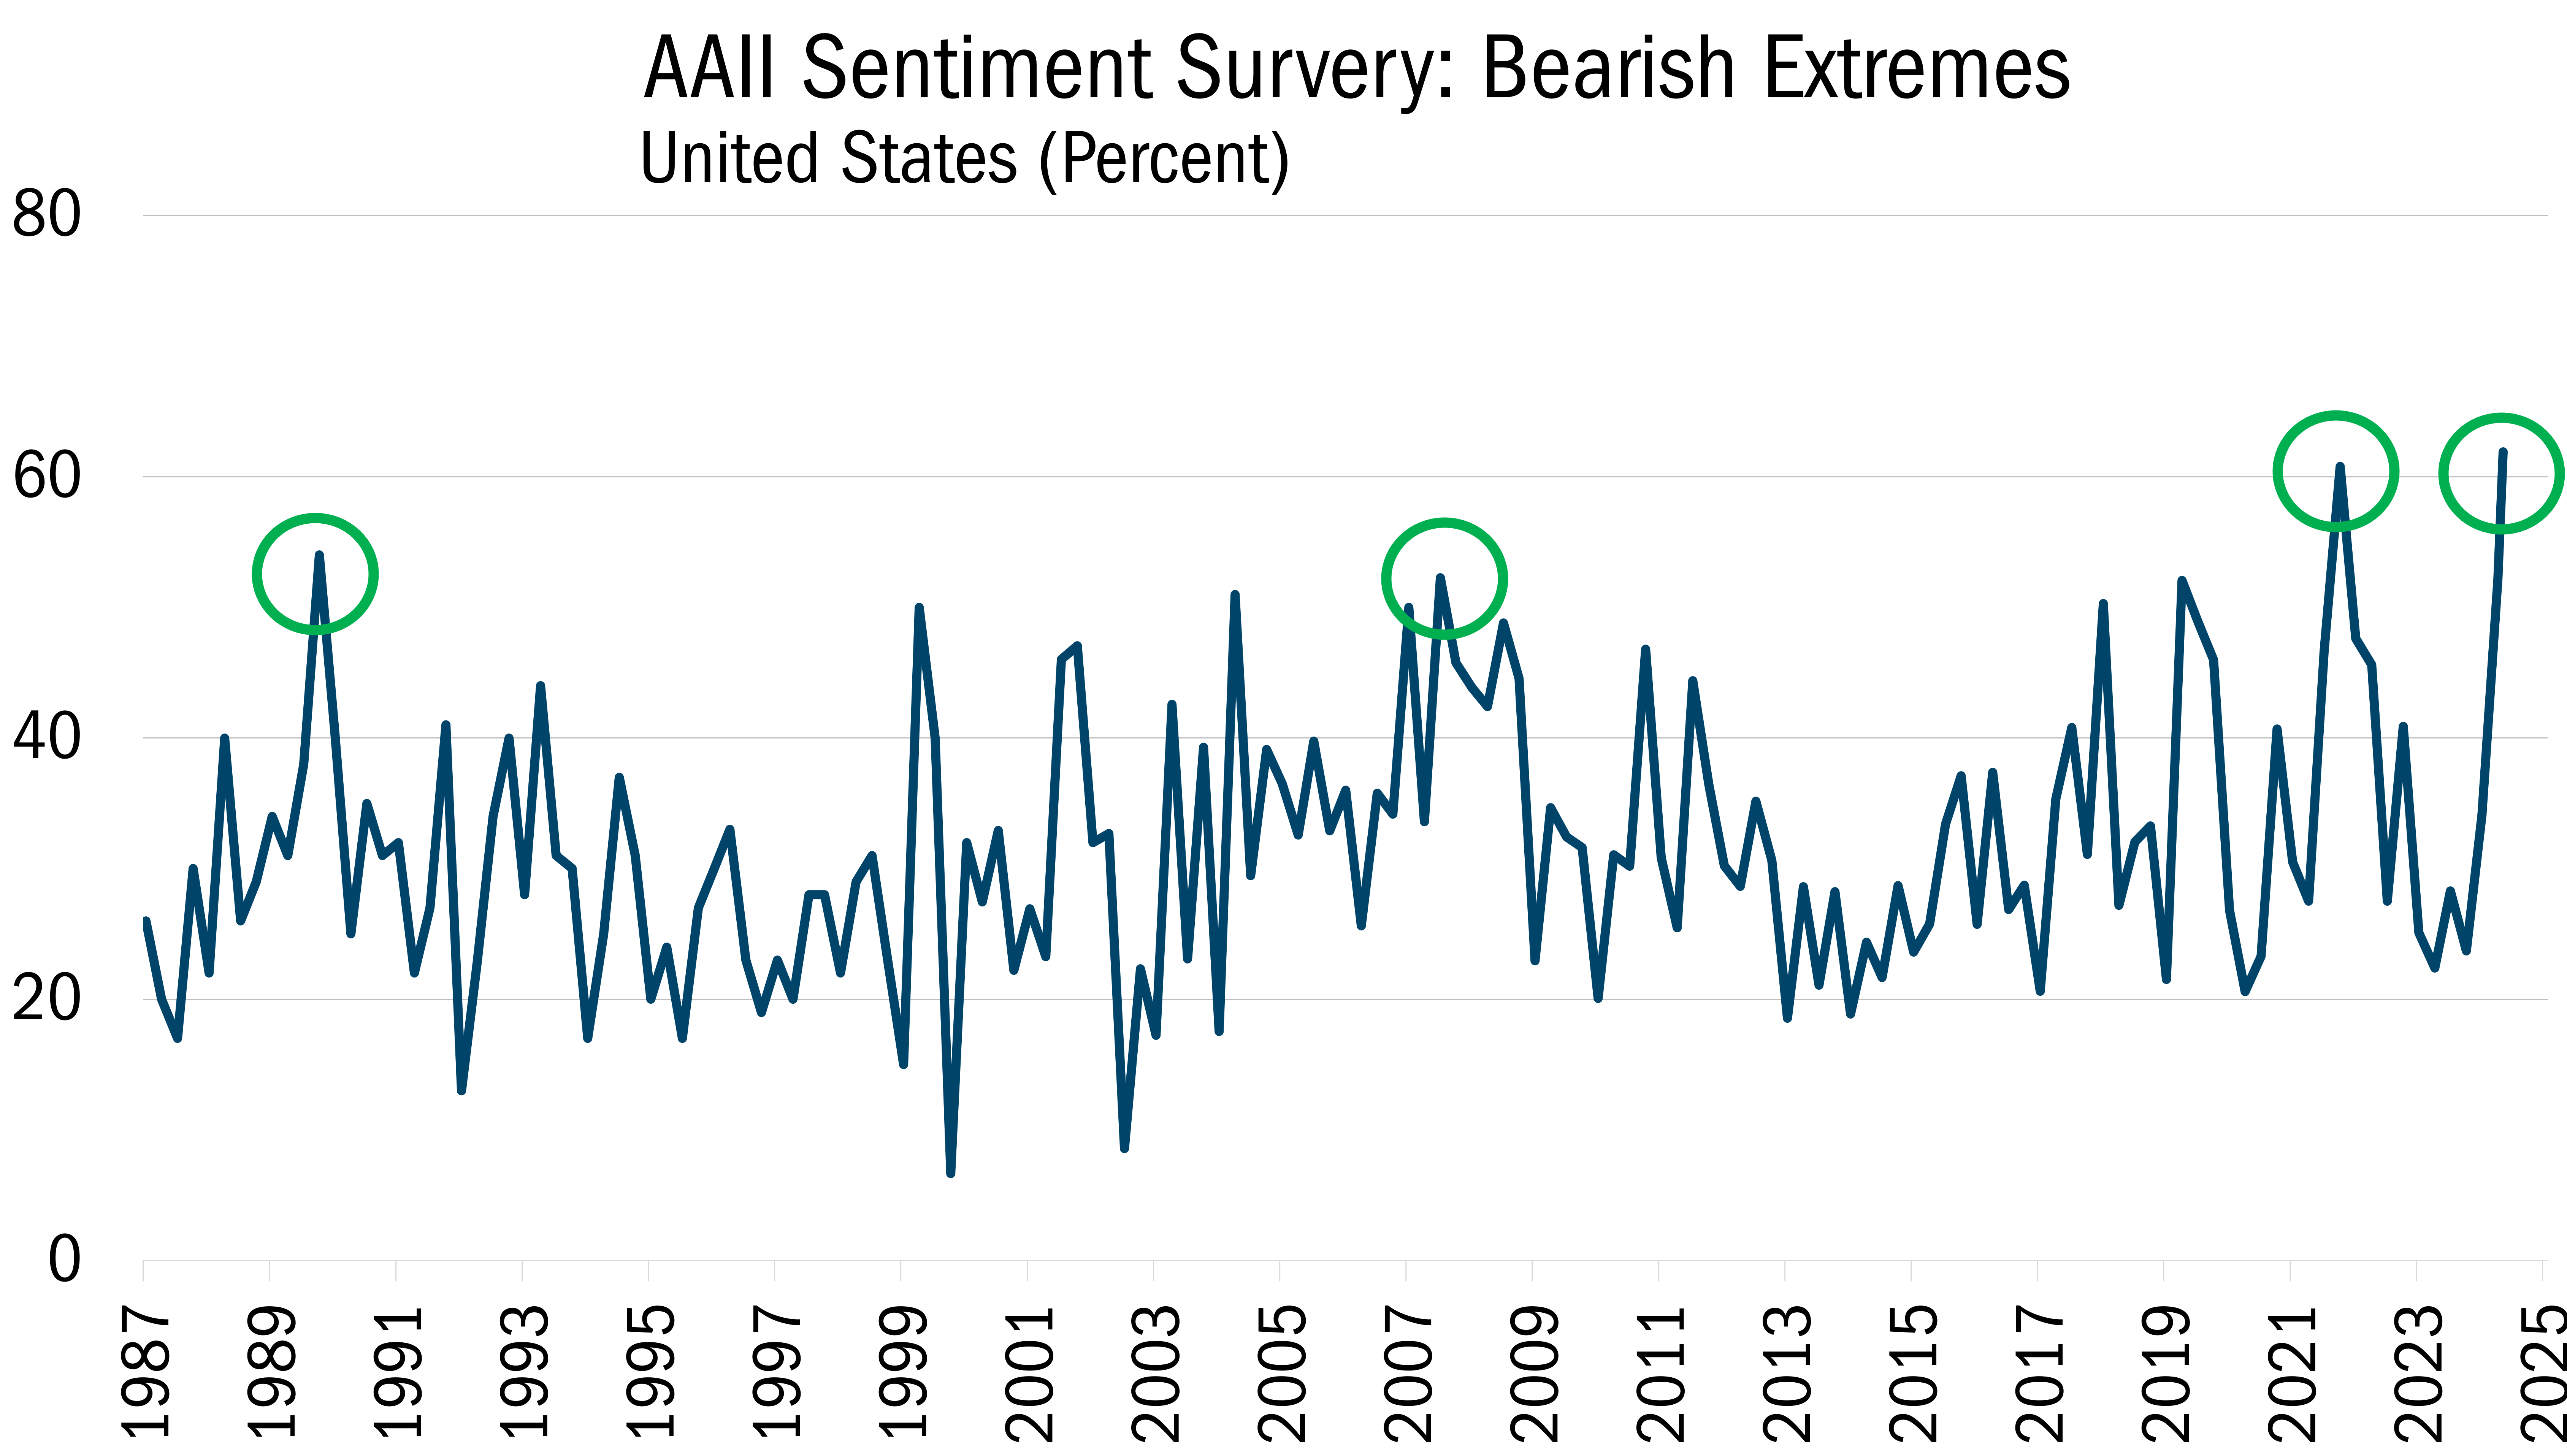
Source: Bloomberg. Quarterly, 9/30/1987 to 4/3/2025. The data in this chart represents the American Association of Individual Investors Sentiment Survey and the rise of bearishness over time. All indices are unmanaged. It is not possible to invest in an index. Past performance does not guarantee future results.

We believe focusing on the micro and understanding the underlying strengths and vulnerabilities of companies in our Strategy helped us navigate the choppy market during the quarter. In our view, the logical response to uncertainty is to think about as wide a range of outcomes as possible, which is what our approach requires us to do. For every company we hold or consider, four price targets are established to weigh both upside potential and downside risks. Those reflect best-case, base-case, downside-risk and max-downside-risk scenarios. By doing so, we try to go into every situation already knowing what to expect should circumstances change for the worse.

This bottoms-up perspective also gives us another advantage: It shows how much value there is in this market and gives us reason to be optimistic. Our holdings in the Heartland Value Fund, for instance, are trading at just 10 times earnings for the next 12 months, representing an earnings yield of 10%. Valuations are just one component of our 10 Principles of Value Investing™, which focuses on identifying attractively priced, well-managed businesses with sound finances and business strategies that will help them grow throughout an entire cycle.

Attribution Analysis & Portfolio Activity

For the quarter, the Heartland Value Strategy fell 3.23%, compared with the 7.74% decline for the Russell 2000® Value Index. We outperformed the benchmark not just during the last three months but also over past 1, 3, and 5 years. Stock selection accounted for all our outperformance in the quarter and was particularly strong in Energy, Materials, Technology, Consumer Discretionary, and Financials. 

During the quarter, we were willing to take what the market was giving us. The conditions may not be ideal, but uncertainty gives rise to fear, bringing about lower stock prices, which provides patient, disciplined investors like us with opportunities.

Recently, we’ve been willing to add to positions in companies where the fundamentals make sense and that have promising levels of insider buying to confirm our views. A good example is Columbus McKinnon Corp. (CMCO), which we initially added to our Strategy in the first quarter. The company designs, manufactures, and distributes materials, handling products, and systems used in a variety of industrial applications, including lifting, precision conveyance, and linear motion. 

Historically, CMCO’s growth has been largely driven by changes in manufacturing activity. A new CEO joined the business in June 2020 with the goal of higher growth and margin applications while increasing the recurring revenue mix. CMCO, however, reported a softer recent quarter due to slowing industrial demand driven by U.S. policy uncertainty. The company also announced a $2.7 billion acquisition of competitor Kito Crosby, which sent the stock plummeting 41% due to uncertainty around execution and an increased leverage profile of 4.8x upon closing. 

We believe Columbus McKinnon offers investors a compelling risk/reward case and a strong catalyst as it seeks to reduce leverage and improve the growth and margin profile of the consolidated business. Management, which has been aggressively purchasing the stock in the open market during the recent sell-off, is targeting mid-20% EBITDA margins upon integration. That’s up from an estimated 15.5% in FY25 pre-acquisition. At the end of the quarter, the stock was trading at about $17 a share. Our current target price target of $54 would imply a valuation of 10.5 times Enterprise Value to EBITDA. Upon execution of the acquisition, however, we believe CMCO should be treated similarly to its industrial peers trading at an average of 12x EV/EBITDA. However, Columbus demonstrates that fundamentals aren’t enough. Our 10 Principles of Value Investing™ demand there be a strong catalyst for recognition to justify holding a stock. 

As the Trump administration’s policies and global jitters rattled the markets during the quarter, investors flocked to precious metals. Gold closed the quarter at a record high of around $3,150 per ounce while silver and copper advanced around 20% for the period. In a dollar-debasing environment, owning physical gold and other metals is receiving increased interest from central banks worldwide as well as an increasingly wide range of investors, both young and old.

For some time we have been supportive of holding hard asset producers such as well financed, profitable miners and their allied providers. A standout performer has been a Canadian producer, New Gold (NGD), owner of the Rainy River gold mine and New Afton copper/gold mines.

The stock has more than doubled this past year, buoyed by increased production, higher grades and reserves, plus lower costs providing a substantial increase in free cash flow. With all-in sustaining costs (AISC) less than $1,400 per ounce, NGD is positioned to prosper. However, now priced in excess net asset value, NAV, we have taken advantage of increased interest and higher prices by trimming holdings. The proceeds were utilized to increase our holdings in two other miners which our research indicates are priced at 50% discounts to their NAV’s.

Outlook

This is what active management is all about. The two great emotions in investing are greed and fear. Within less than two quarters, this market swung from one to the other. Will tariffs lead to a slowdown, recession, or something worse? Nobody knows with absolute certainty. But if there’s anything we’ve learned in the 40+plus years of managing money, it’s the folly of trying to guess what’s going to transpire at the macro level in the short-term. 

What really matters is being able to control your emotions and focus on the micro over the long run in conjunction with a risk management mindset. When you do that and follow Peter Lynch’s advice by getting to know what each of your companies is doing, you will discover how much value there is for those willing to do the research. We believe today’s emotionally charged extreme is setting up opportunities for the active, value-based investor.

Fundamentally yours,

The Heartland Investment Team

Please wait while we gather your results.

Portfolio Management Team

Heartland Advisors Value Investing Portfolio Manager Will Nasgovitz

Will Nasgovitz

CEO and Portfolio Manager

Heartland Advisors Value Investing Portfolio Manager Bill Nasgovitz

Bill Nasgovitz

Chairman and Portfolio Manager

Composite Returns*

3/31/2025

Scroll over to view complete data

Since Inception (%)10-Year (%)5-Year (%)3-Year (%)1-Year (%)YTD (%)QTD (%)
Small Cap Value Composite (Net of Advisory Fees)**10.725.0720.706.519.83-3.15-3.15
Small Cap Value Composite (Net of Bundled Fees)9.284.7120.366.199.50-3.23-3.23
Russell 2000® Value9.636.0715.310.05-3.12-7.74-7.74

Source: FactSet Research Systems Inc., Russell Investment Group, and Heartland Advisors, Inc.
*Yearly and quarterly returns are not annualized. The Strategy's inception date is 10/1/1988. 
**Shown as supplemental information. 

The US Dollar is the currency used to express performance. Returns are presented net of advisory fees and net of bundled fees and include the reinvestment of all income. The returns net of bundled fees were calculated by subtracting the highest applicable sponsor portion of the separately managed wrap account fee from the net of advisor fees return.

Small Cap Value Strategy Quick Links

Factsheet


Download PDF

Commentary


View Commentary

Attribution & Contribution Reports

Sign In

Holdings


Sign In


Email Sign Up


©2025 Heartland Advisors | 790 N. Water Street, Suite 1200, Milwaukee, WI 53202 | Business Office: 414-347-7777 | Financial Professionals: 888-505-5180 | Individual Investors: 800-432-7856

Past performance does not guarantee future results.

The Small Cap Value Strategy seeks long-term capital appreciation by investing in micro- and small-cap companies, generally with market capitalizations of less than the largest companies in the Russell 2000 Value Index, at the time of purchase. The micro- and small-cap segment of the stock market is robust with thousands of publicly traded issues, many of which lack traditional Wall Street research coverage. Thus, we believe this market is often inefficient, mispricing businesses and offering opportunities for fundamental research-minded investors such as Heartland.

The Small Cap Value Strategy invests in small companies selected on a value basis. Such securities generally are more volatile and less liquid than those of larger companies.

Value investments are subject to the risk that their intrinsic values may not be recognized by the broader market. 

Heartland Advisors, Inc. (the “Firm”) claims compliance with the Global Investment Performance Standards (GIPS®). The Firm is a wholly owned subsidiary of Heartland Holdings, Inc. and is registered with the Securities and Exchange Commission. For a complete list and description of Heartland Advisors composites and/or a presentation that adheres to the GIPS® standards, contact Institutional Sales at Heartland Advisors, Inc. at the address listed below.

As of 3/31/2025, Columbus McKinnon Corporation (CMCO) and New Gold Inc. (NGD) represented 2.98% and 2.75% of the Small Cap Value Composite’s net assets, respectively.  

The future performance of any specific investment or strategy (including the investments discussed above) should not be assumed to be profitable or equal to past results. The performance of the holdings discussed above may have been the result of unique market circumstances that are no longer relevant. The holdings identified above do not represent all of the securities purchased, sold or recommended for the Advisor’s clients.

Portfolio holdings are subject to change. Current and future portfolio holdings are subject to risk.

Statements regarding securities are not recommendations to buy or sell.

In certain cases, dividends and earnings are reinvested.

GIPS® is a registered trademark of CFA Institute. CFA Institute does not endorse or promote this organization, nor does it warrant the accuracy or quality of the content contained herein.

Separately managed accounts and related investment advisory services are provided by Heartland Advisors, Inc., a federally registered investment advisor. ALPS Distributors, Inc., is not affiliated with Heartland Advisors, Inc.

The statements and opinions expressed in this article are those of the presenter(s). Any discussion of investments and investment strategies represents the presenters’ views as of the date created and are subject to change without notice. The opinions expressed are for general information only and are not intended to provide specific advice or recommendations for any individual. The specific securities discussed, which are intended to illustrate the advisor’s investment style, do not represent all of the securities purchased, sold, or recommended by the advisor for client accounts, and the reader should not assume that an investment in these securities was or would be profitable in the future. Certain security valuations and forward estimates are based on Heartland Advisors’ calculations. Any forecasts may not prove to be true. 

Economic predictions are based on estimates and are subject to change.

There is no guarantee that a particular investment strategy will be successful.

Sector and Industry classifications are sourced from GICS®.The Global Industry Classification Standard (GICS®) is the exclusive intellectual property of MSCI Inc. (MSCI) and S&P Global Market Intelligence (“S&P”).  Neither MSCI, S&P, their affiliates, nor any of their third party providers (“GICS Parties”) makes any representations or warranties, express or implied, with respect to GICS or the results to be obtained by the use thereof, and expressly disclaim all warranties, including warranties of accuracy, completeness, merchantability and fitness for a particular purpose.  The GICS Parties shall not have any liability for any direct, indirect, special, punitive, consequential or any other damages (including lost profits) even if notified of such damages.

Heartland Advisors defines market cap ranges by the following indices: micro-cap by the Russell Microcap®, small-cap by the Russell 2000®, mid-cap by the Russell Midcap®, large-cap by the Russell Top 200®.

Because of ongoing market volatility, performance may be subject to substantial short-term changes.

Dividends are not guaranteed and a company’s future ability to pay dividends may be limited. A company currently paying dividends may cease paying dividends at any time.

There is no assurance that dividend-paying stocks will mitigate volatility.

Russell Investment Group is the source and owner of the trademarks, service marks and copyrights related to the Russell Indices. Russell® is a trademark of the Frank Russell Investment Group.

Data sourced from FactSet: Copyright 2025 FactSet Research Systems Inc., FactSet Fundamentals. All rights reserved.

Heartland’s investing glossary provides definitions for several terms used on this page.

Buyback is the repurchase of outstanding shares (repurchase) by a company in order to reduce the number of shares on the market. Enterprise Value/Earnings Before Interest, Taxes, Depreciation, and Amortization (EV/EBITDA) Ratio is a financial indicator used to determine the value of a company and is calculated by dividing the entire economic value of the company (enterprise value) by its earnings before interest, taxes, depreciation, and amortization (EBITDA). Earnings Per Share is the portion of a company’s profit allocated to each outstanding share of common stock. Earnings Yield is the reciprocal of the price to earnings ratio.  Free Cash Flow is the amount of cash a company has after expenses, debt service, capital expenditures, and dividends. The higher the free cash flow, the stronger the company’s balance sheet. Insider Buying is the purchase of a company's stock by individual directors, executives or other employees. Margin of Safety is a principle of investing in which an investor only purchases securities when the market price is significantly below its intrinsic value. Price/Earnings Ratio of a stock is calculated by dividing the current price of the stock by its trailing or its forward 12 months’ earnings per share.  Russell Investment Group is the source and owner of the trademarks, service marks and copyrights related to the Russell Indices. Russell® is a trademark of the Russell Investment Group. Russell 2000® Index includes the 2000 firms from the Russell 3000® Index with the smallest market capitalizations. All indices are unmanaged. It is not possible to invest directly in an index. Russell 2000® Value Index measures the performance of those Russell 2000® companies with lower price/book ratios and lower forecasted growth characteristics. S&P 500 Index is an index of 500 U.S. stocks chosen for market size, liquidity and industry group representation and is a widely used U.S. equity benchmark. All indices are unmanaged. It is not possible to invest directly in an index. S&P 600 Index is a group of 600 U.S. stocks chosen for their market size, liquidity and industry group representation. All indices are unmanaged. It is not possible to invest directly in an index. 10 Principles of Value Investing™ consist of the following criteria for selecting securities: (1) catalyst for recognition; (2) low price in relation to earnings; (3) low price in relation to cash flow; (4) low price in relation to book value; (5) financial soundness; (6) positive earnings dynamics; (7) sound business strategy; (8) capable management and insider ownership; (9) value of company; and (10) positive technical analysis.

top