Heartland Advisors

Heartland Value Fund 3Q24 Portfolio Manager Commentary

Executive Summary

  • The Heartland Value Fund appreciated 9.83% for the quarter, versus 10.15% for the Russell 2000® Value Index, but continues to outpace its benchmark year to date.
  • Results were due almost entirely to security selection. In volatile times, we believe active investment management is paramount.
  • Small value stocks should benefit from further rate cuts, but it may take time.
  • Now is the time to focus on what can be controlled. For us, that means constantly improving our process.

Past performance is no guarantee of future results and investment returns and principal value of the Fund will fluctuate so that shares, when redeemed, may be worth more or less than the original cost. Current performance may be higher or lower than the performance quoted. Call 800-432-7856 or visit heartlandadvisors.com for current month end performance.

“Winning isn’t getting ahead of others. It’s getting ahead of yourself.”
— Roger Staubach

The third quarter showed how easy it is to get caught up in the horse-race aspects of investing. As the Federal Reserve moved to cut interest rates in September, questions immediately arose: Who are the likely winners and losers of an accommodative monetary policy? Which equities might be headed higher or lower over the course of the easing cycle? And is this the catalyst that could finally propel small value ahead of large growth?

This can be a pointless exercise, especially since the answers are almost never clear, nor instantaneous. For example, while history tells us that value stocks will eventually come back into favor, additional patience may be required, as growth doesn’t typically relinquish its advantage until midway into an easing cycle, according to research by The Leuthold Group.

Similarly, while we believe small caps will benefit from lower borrowing costs, the economic concerns that drove the Federal Reserve to act may continue to pressure emerging businesses in the short term. That’s why it’s important to identify companies with strong financials and healthy free cash flow, without overpaying, as outlined in our 10 Principles of Value Investing™. Of course, this area of the market has performed so poorly, relatively speaking, over the past three years, that the bar is set pretty low for this group (see chart below). This gives us confidence in the opportunity set for our asset class, even if the precise timing is unclear.

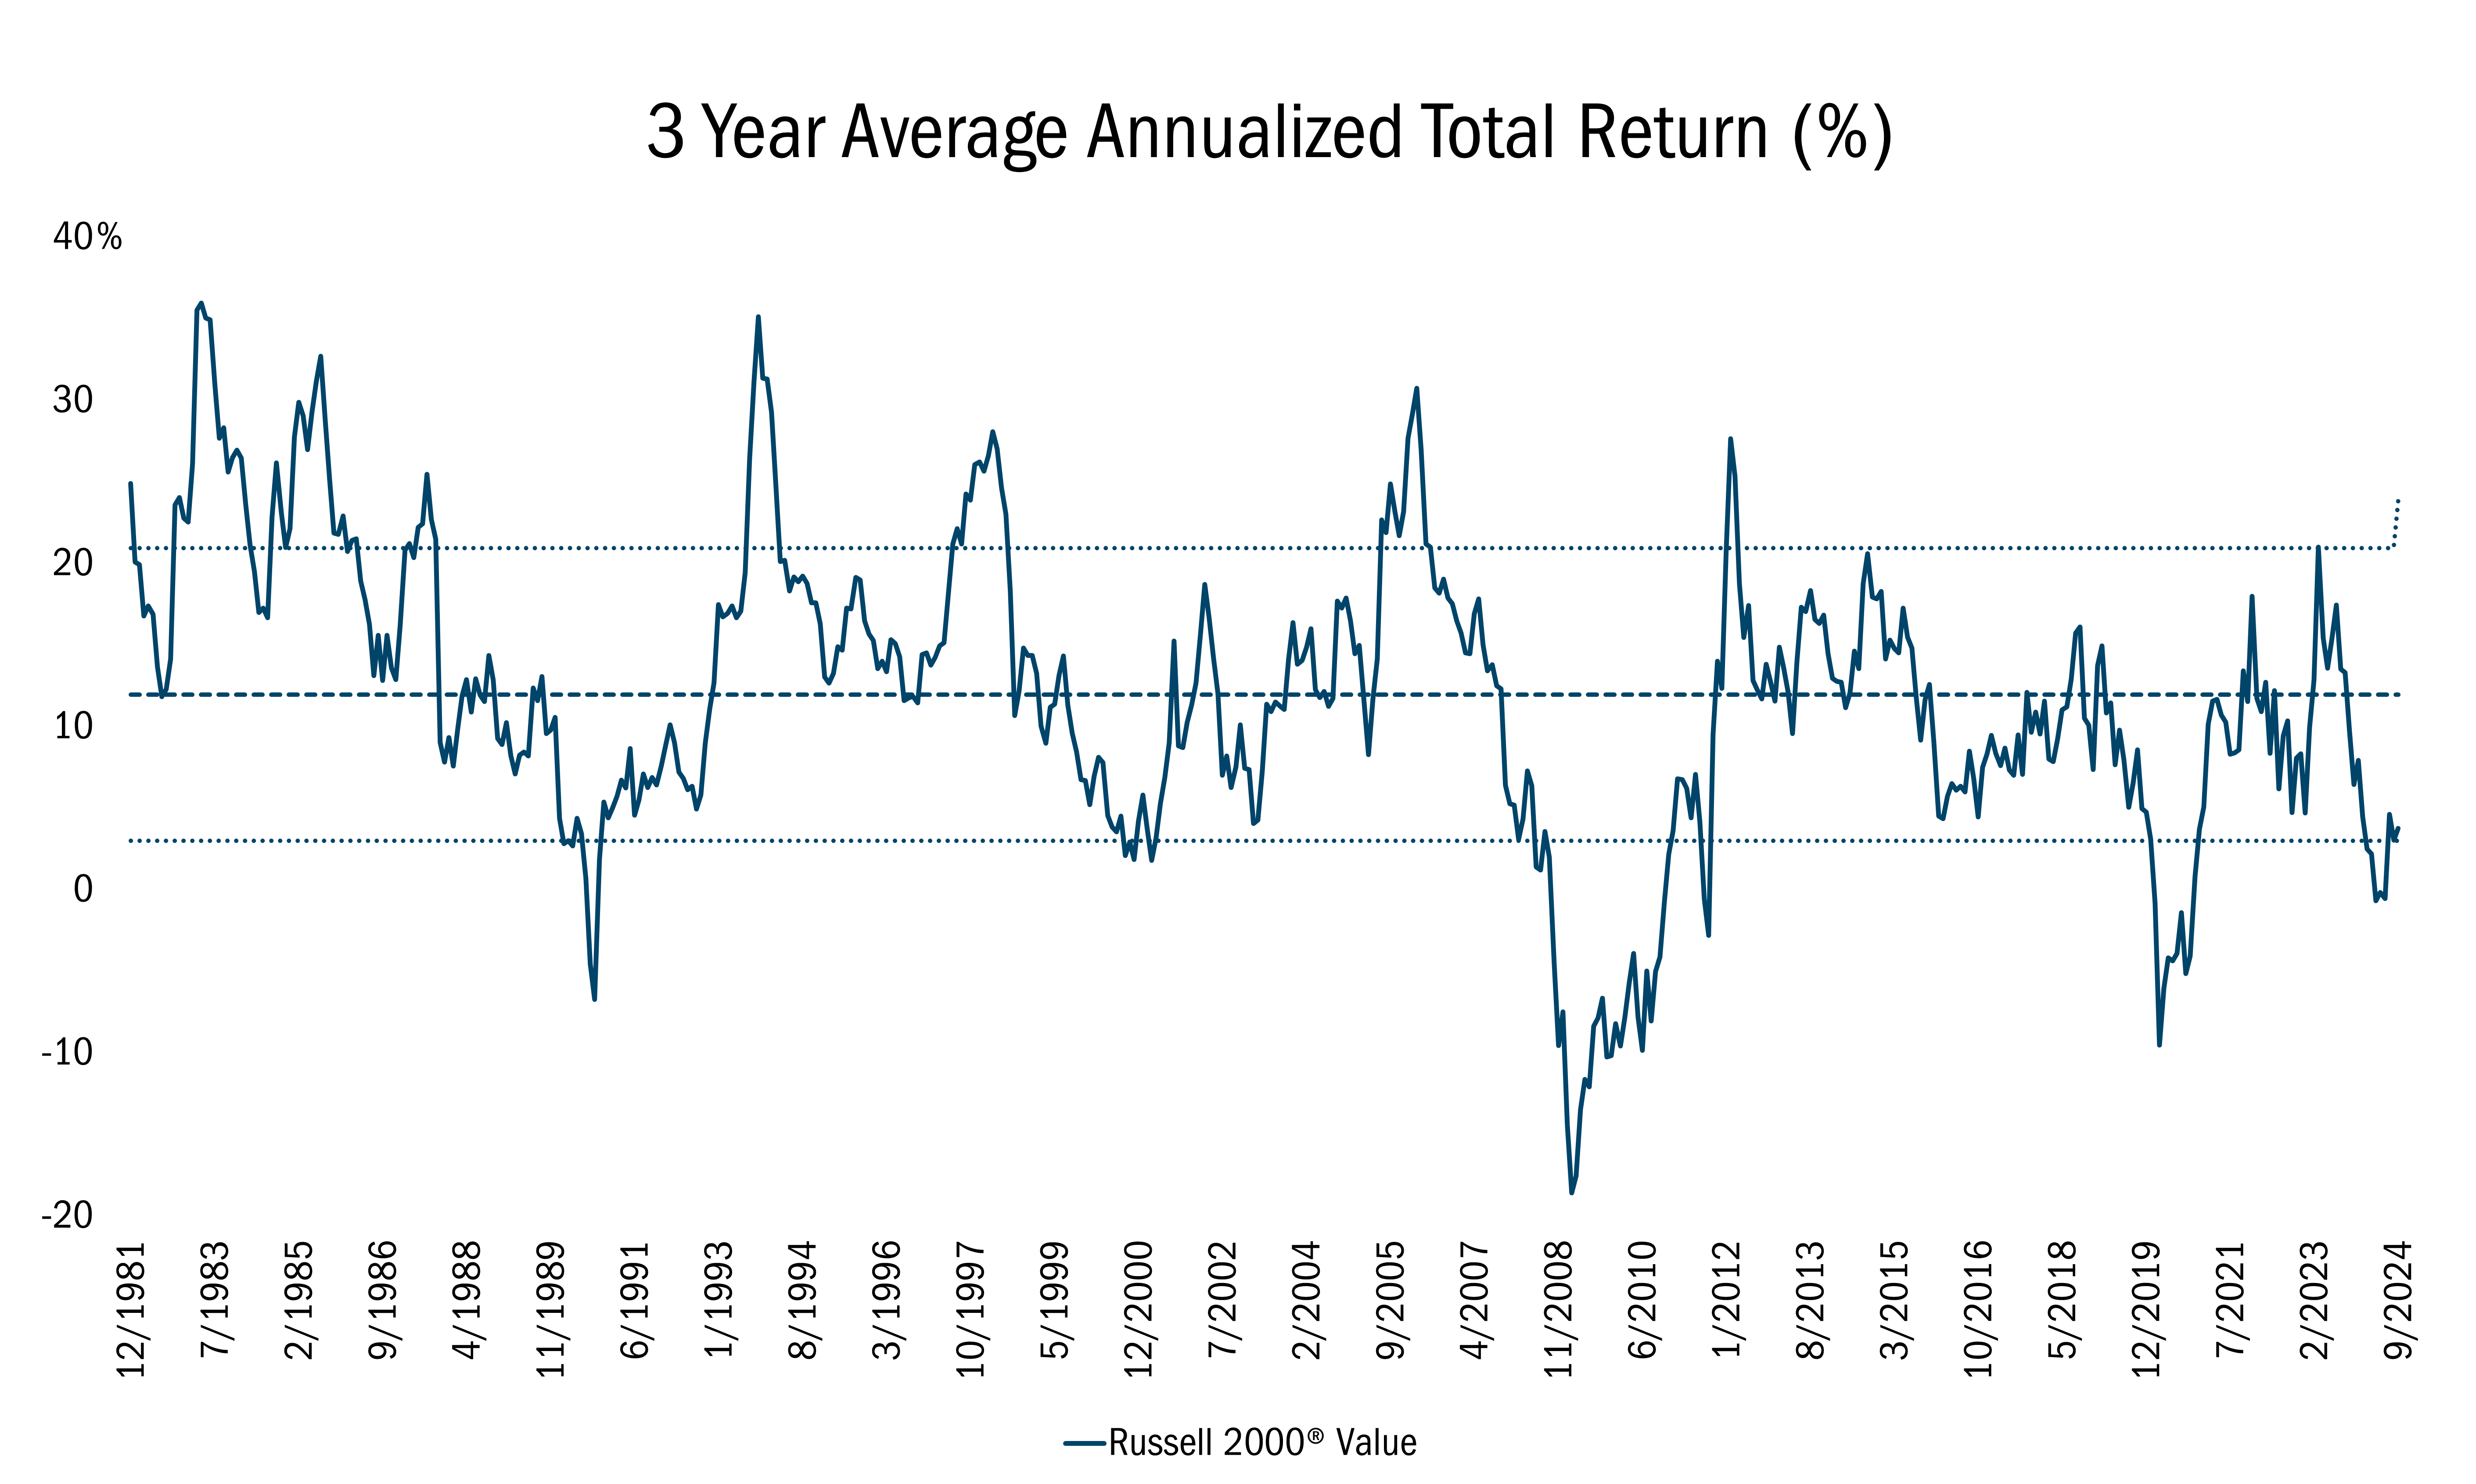
Source: FactSet Research Systems Inc. and Russell®, monthly data from12/1/1981 to 9/30/2024. This chart represents the 3-year average annualized total return percentage for the Russell 2000® Value Index. All indices are unmanaged. It is not possible to invest directly in an index. Past performance does not guarantee future results.

In times like these, we are reminded of the words of Hall of Fame quarterback turned successful commercial real estate investor Roger Staubach, who argued that winning shouldn’t be measured by how far ahead you are of others in any short time. Instead, it’s how much you grow in your own development and capacity in the long run.

We agree. At Heartland, our 10 Principles of Value Investing™ guide every investment decision we make. While those rules are unwavering, we are committed to looking for new and more effective ways to put our beliefs into practice with the goal of delivering consistent performance over time. While success is by no means guaranteed, we are proud that over the past one, three, and five years, according to Morningstar, the Heartland Value Fund has finished in the top third of all small value funds.

Attribution Analysis & Portfolio Activity

For the quarter, the Heartland Value Fund gained 9.83%, trailing the Russell 2000® Value Index, which returned 10.15%. Security selection was mixed over the past three months, with the Strategy outperforming the benchmark in Consumer Discretionary, Consumer Services, Energy, Financials, and Materials. We lagged in other areas such as Information Technology, where semiconductor stocks dragged performance, as well as Health Care. 

Year to date, the Fund is up 13.45% versus 9.22% for the Index, with security selection being the primary reason for the outperformance. Stock picking was also the major driver of our performance over the past one, three, and five years. 

It is worth noting that we don’t select securities in a vacuum. We are constantly assessing the portfolio’s overall risks and short falls. Then we identify ideas that are both attractive from an upside/downside perspective that can play a key role in addressing deficiencies in our Strategy. This active awareness is a critical part of our process. It is akin to constructing a winning football team. The impulse in every NFL draft may be to select the best quarterback coming out of college. But that may not make sense if you already have a franchise QB and need to shore up your defense. That’s how we go about picking stocks — we look for situations where our needs and opportunities converge.

A good example is Alexander & Baldwin (ALEX). We generally aim not to deviate too far from the sector weightings of our benchmark, preferring to let security selection and our 10 Principles of Value Investing™ — not industry bets — drive our performance relative to our active and passive peers. 

Entering the quarter, Real Estate was among our largest underweights, so we were aware of the potential need to boost our exposure. Toward that end, we began reviewing Alexander & Baldwin two years ago but held off on the commercial real estate firm because of a road construction business we felt muddled their investment case. The company has since divested that non-core asset, making ALEX a pure-play REIT with retail, industrial, and office properties exclusively in Hawaii. 

For every investment under consideration, we keep track of a grid of attributes that gives us a better sense of the comparative prospects for that investment. With Hawaii’s strong household income, low unemployment, and high proportion of stable government spending, ALEX’s state-focused approach has improved the stock’s grid score to 7 out of 10, putting it at the upper end of our real estate holdings. Priced well below our assessment of intrinsic worth plus a robust dividend yield of 4.6%; we added ALEX to the Fund.

By contrast, Osisko Gold Royalties (OR) is a successful holding which we exited this year because its grid score deteriorated. As interest in gold has grown, shares of the company, which acquires and manages precious metal royalties worldwide, appreciated substantially. However, production difficulties at one of their key producing mines surfaced, thus reducing our estimates of earnings and cash flows. Together these increased the risk while lessening the reward potential for Osisko, causing our valuation of the company to fall, and putting it at the bottom of the mining stocks in our portfolio. With a price to cash flow ratio of close to 20X and the grid score deteriorating to only 5 of 10, we believed there were better values elsewhere.

For example, our research indicated the outlook for New Gold (NGD), a pure Canadian gold and copper producer, was steadily improving. NGD has met guidance for eight consecutive quarters, as both of its mines are hitting their production stride. The company is forecast to tap approximately 600,000 ounces of gold equivalent in FY2026, up 42% compared with last year’s output. Excellent drilling results coupled with better efficiencies have reduced New Gold’s all-in sustaining costs (AISC) to $1,381 per ounce of gold, down from a recent high of $1,657. The company is on track to slash AISC’s more than 50% by 2026. 

Under new management headed by CEO Patrick Godin, who joined in 2022, NGD is enjoying financial flexibility that allows for exploration to grow reserves and extend the life of mines. The team continues to execute significantly increasing production, cutting costs, and posting exceptionally strong free cash flows. Our research process was validated by strong insider buying in the company. Yet despite doubling in value, NGD was priced at 8x our estimated 2025 earnings, less than 6.5x free cash flow and scored 8/10 on our research grid. We added to the position.

Outlook

Although our confidence in small value stocks is unwavering based on the unrecognized opportunities in this segment, we believe patience will be required. We expect the backdrop for this segment to improve, as the Federal Reserve embarks on its first easing cycle since the global pandemic. However, historically these policy turns have taken longer than expected to unfold. While we wait patiently, we remain committed to staying true to our 10 Principles of Value Investing™ while constantly improving our process to optimize our performance over time. 

We thank you for your continued trust and confidence in Heartland.
Fundamentally yours,
The Heartland Investment Team

Please wait while we gather your results.

Portfolio Management Team

Heartland Advisors Value Investing Portfolio Manager Will Nasgovitz

Will Nasgovitz

CEO and Portfolio Manager

Heartland Advisors Value Investing Portfolio Manager Bill Nasgovitz

Bill Nasgovitz

Chairman and Portfolio Manager

Fund Returns

9/30/2024

Scroll over to view complete data

Since Inception (%)20-Year (%)15-Year (%)10-Year (%)5-Year (%)3-Year (%)1-Year (%)YTD* (%)QTD* (%)
Value
Investor Class
11.237.168.627.2012.058.5426.7013.459.83
Value
Institutional Class
11.317.318.807.3612.208.6826.9013.629.86
Russell 2000® Value10.557.749.808.229.293.7725.889.2210.15
*Not annualized

Source: FactSet Research Systems Inc., Russell®, and Heartland Advisors, Inc.

The inception date for the Value Fund is 12/28/1984 for the investor class and 5/1/2008 for the institutional class.

Value Fund Quick Links

Factsheet


Download PDF

Commentary


View Commentary

Attribution & Contribution Reports

Sign In

Holdings


View Holdings


Email Sign Up


©2024 Heartland Advisors | 790 N. Water Street, Suite 1200, Milwaukee, WI 53202 | Business Office: 414-347-7777 | Financial Professionals: 888-505-5180 | Individual Investors: 800-432-7856

In the prospectus dated 5/1/2024, the Gross Fund Operating Expenses for the investor and institutional classes of the Value Fund are 1.07% and 0.89%, respectively.

Past performance does not guarantee future results. Performance represents past performance; current returns may be lower or higher. Performance for institutional class shares prior to their initial offering is based on the performance of investor class shares. The investment return and principal value will fluctuate so that an investor's shares, when redeemed, may be worth more or less than the original cost. All returns reflect reinvested dividends and capital gains distributions, but do not reflect the deduction of taxes that an investor would pay on distributions or redemptions. Subject to certain exceptions, shares of a Fund redeemed or exchanged within 10 days of purchase are subject to a 2% redemption fee. Performance does not reflect this fee, which if deducted would reduce an individual's return. To obtain performance through the most recent month end, call 800-432-7856 or visit heartlandadvisors.com.

An investor should consider the Funds’ investment objectives, risks, and charges and expenses carefully before investing or sending money. This and other important information may be found in the Funds' prospectus. To obtain a prospectus, please call 800-432-7856 or visit heartlandadvisors.com. Please read the prospectus carefully before investing.

As of 9/30/2024, Alexander & Baldwin, Inc. (ALEX) and New Gold, Inc. (NGD) represented 0.63% and 1.50% of the Value Fund’s net assets, respectively. Osisko Gold Royalties Ltd. (OR) is unowned by Heartland Advisors, Inc.

Statements regarding securities are not recommendations to buy or sell.

Portfolio holdings are subject to change. Current and future portfolio holdings are subject to risk.

The Value Fund invests primarily in small companies selected on a value basis. Such securities generally are more volatile and less liquid than those of larger companies.

Value investments are subject to the risk that their intrinsic value may not be recognized by the broad market.

The Value Fund seeks long-term capital appreciation through investing in small companies.

Information about Morningstar Ratings™ are ©2024 Morningstar, Inc. All rights reserved. The information contained herein is (1) proprietary to Morningstar and/or its content providers; (2) may not be copied or distributed, and (3) is not warranted to be accurate, complete or timely. Neither Morningstar nor its content providers are responsible for any damages or losses arising from any use of this information. Past performance is no guarantee of future results.

The Morningstar RatingTM for funds, or "star rating", is calculated for managed products (including mutual funds, variable annuity and variable life subaccounts, exchange-traded funds, closed-end funds, and separate accounts) with at least a three-year history. Exchange-traded funds and open-ended mutual funds are considered a single population for comparative purposes. It is calculated based on a Morningstar Risk-Adjusted Return measure that accounts for variation in a managed product's monthly excess performance, placing more emphasis on downward variations and rewarding consistent performance. The top 10% of products in each product category receive 5 stars, the next 22.5% receive 4 stars, the next 35% receive 3 stars, the next 22.5% receive 2 stars, and the bottom 10% receive 1 star. The Overall Morningstar Rating for a managed product is derived from a weighted average of the performance figures associated with its three-, five-, and 10-year (if applicable) Morningstar Rating metrics. The weights are: 100% three-year rating for 36-59 months of total returns, 60% five-year rating/40% three-year rating for 60-119 months of total returns, and 50% 10-year rating/30% five-year rating/20% three-year rating for 120 or more months of total returns. While the 10-year overall star rating formula seems to give the most weight to the 10-year period, the most recent three-year period actually has the greatest impact because it is included in all three rating periods.

As of 9/30/24, the Value Fund Investor Class was rated against 446, 420, 326, and 446 U.S.-domiciled Small Value funds over the 3-, 5-, 10-year, and overall periods, respectively and has Morningstar’s 4-star rating for the 3-year, 4-star rating for the 5-year, 3-star rating for the 10-year, and 4-star rating for the overall periods. 

The above individuals are registered representatives of ALPS Distributors, Inc.

The Fund’s performance information included in regulatory filings includes a required index that represents an overall securities market (Regulatory Benchmark). In addition, the Fund's regulatory filings may also include an index that more closely aligns to the Fund's investment strategy (Strategy Benchmark(s)). The Fund's performance included in marketing and advertising materials and information other than regulatory filings is generally compared only to the Strategy Benchmark.

The Heartland Funds are distributed by ALPS Distributors, Inc.

The statements and opinions expressed in this article are those of the presenter(s). Any discussion of investments and investment strategies represents the presenters’ views as of the date created and are subject to change without notice. The opinions expressed are for general information only and are not intended to provide specific advice or recommendations for any individual. The specific securities discussed, which are intended to illustrate the advisor’s investment style, do not represent all of the securities purchased, sold, or recommended by the advisor for client accounts, and the reader should not assume that an investment in these securities was or would be profitable in the future. Certain security valuations and forward estimates are based on Heartland Advisors’ calculations. Any forecasts may not prove to be true. 

Economic predictions are based on estimates and are subject to change.

There is no guarantee that a particular investment strategy will be successful.

Sector and Industry classifications are sourced from GICS®.The Global Industry Classification Standard (GICS®) is the exclusive intellectual property of MSCI Inc. (MSCI) and S&P Global Market Intelligence (“S&P”).  Neither MSCI, S&P, their affiliates, nor any of their third party providers (“GICS Parties”) makes any representations or warranties, express or implied, with respect to GICS or the results to be obtained by the use thereof, and expressly disclaim all warranties, including warranties of accuracy, completeness, merchantability and fitness for a particular purpose.  The GICS Parties shall not have any liability for any direct, indirect, special, punitive, consequential or any other damages (including lost profits) even if notified of such damages.

Heartland Advisors defines market cap ranges by the following indices: micro-cap by the Russell Microcap®, small-cap by the Russell 2000®, mid-cap by the Russell Midcap®, large-cap by the Russell Top 200®.

Because of ongoing market volatility, performance may be subject to substantial short-term changes.

Dividends are not guaranteed and a company’s future ability to pay dividends may be limited. A company currently paying dividends may cease paying dividends at any time.

There is no assurance that dividend-paying stocks will mitigate volatility.

Russell Investment Group is the source and owner of the trademarks, service marks and copyrights related to the Russell Indices. Russell® is a trademark of the Frank Russell Investment Group.

Data sourced from FactSet: Copyright 2024 FactSet Research Systems Inc., FactSet Fundamentals. All rights reserved.

Buyback is the repurchase of outstanding shares (repurchase) by a company in order to reduce the number of shares on the market. Enterprise Value/Earnings Before Interest, Taxes, Depreciation, and Amortization (EV/EBITDA) Ratio is a financial indicator used to determine the value of a company and is calculated by dividing the entire economic value of the company (enterprise value) by its earnings before interest, taxes, depreciation, and amortization (EBITDA). Earnings Per Share is the portion of a company’s profit allocated to each outstanding share of common stock. Earnings Yield is the reciprocal of the price to earnings ratio.  Free Cash Flow is the amount of cash a company has after expenses, debt service, capital expenditures, and dividends. The higher the free cash flow, the stronger the company’s balance sheet. Insider Buying is the purchase of a company's stock by individual directors, executives or other employees. Margin of Safety is a principle of investing in which an investor only purchases securities when the market price is significantly below its intrinsic value. Price/Earnings Ratio of a stock is calculated by dividing the current price of the stock by its trailing or its forward 12 months’ earnings per share.  Russell Investment Group is the source and owner of the trademarks, service marks and copyrights related to the Russell Indices. Russell® is a trademark of the Russell Investment Group. Russell 2000® Index includes the 2000 firms from the Russell 3000® Index with the smallest market capitalizations. All indices are unmanaged. It is not possible to invest directly in an index. Russell 2000® Value Index measures the performance of those Russell 2000® companies with lower price/book ratios and lower forecasted growth characteristics. S&P 500 Index is an index of 500 U.S. stocks chosen for market size, liquidity and industry group representation and is a widely used U.S. equity benchmark. All indices are unmanaged. It is not possible to invest directly in an index. S&P 600 Index is a group of 600 U.S. stocks chosen for their market size, liquidity and industry group representation. All indices are unmanaged. It is not possible to invest directly in an index. 10 Principles of Value Investing™ consist of the following criteria for selecting securities: (1) catalyst for recognition; (2) low price in relation to earnings; (3) low price in relation to cash flow; (4) low price in relation to book value; (5) financial soundness; (6) positive earnings dynamics; (7) sound business strategy; (8) capable management and insider ownership; (9) value of company; and (10) positive technical analysis.

Heartland’s investing glossary provides definitions for several terms used on this page.

top