Heartland Advisors

Heartland Value Plus Fund 3Q24 Portfolio Manager Commentary

Executive Summary

  • The market began to broaden out during the quarter, as small stocks advanced in anticipation of Federal Reserve interest rate cuts.
  •  An easing cycle should benefit stocks positioned for an uptick in earnings once demand dynamics improve.
  • The good news is that companies with compelling self-help strategies are being rewarded. 

See standardized performance at the end.

Third Quarter Market Discussion

Throughout the year, we have been looking for ‘green shoots’ in the market. We are focused on companies with strong capital allocation policies and stabilizing sales that we think could enjoy an uptick in earnings once demand dynamics improve, self-help strategies gain traction, and the market broadens out. 

On that front, investors received some hopeful news late in the quarter when the Federal Reserve began to cut short-term interest rates for the first time since the global pandemic. Optimism in anticipation of an easing cycle helped lift the Russell 2000® Index of small stocks up 9.27% in the third quarter, versus the 5.89% gains for the S&P 500 Index.

Rate cuts could eventually lead to a modest demand push, augmenting the existing green shoots we are focusing on – especially for companies tied to housing. As the chart below shows, the National Association of Realtors’ Pending Existing Home Sales Index is at its lowest levels since the pandemic, foreshadowing a potential rebound now that rates are falling, especially if the Federal Reserve has managed to pull off a soft landing. 

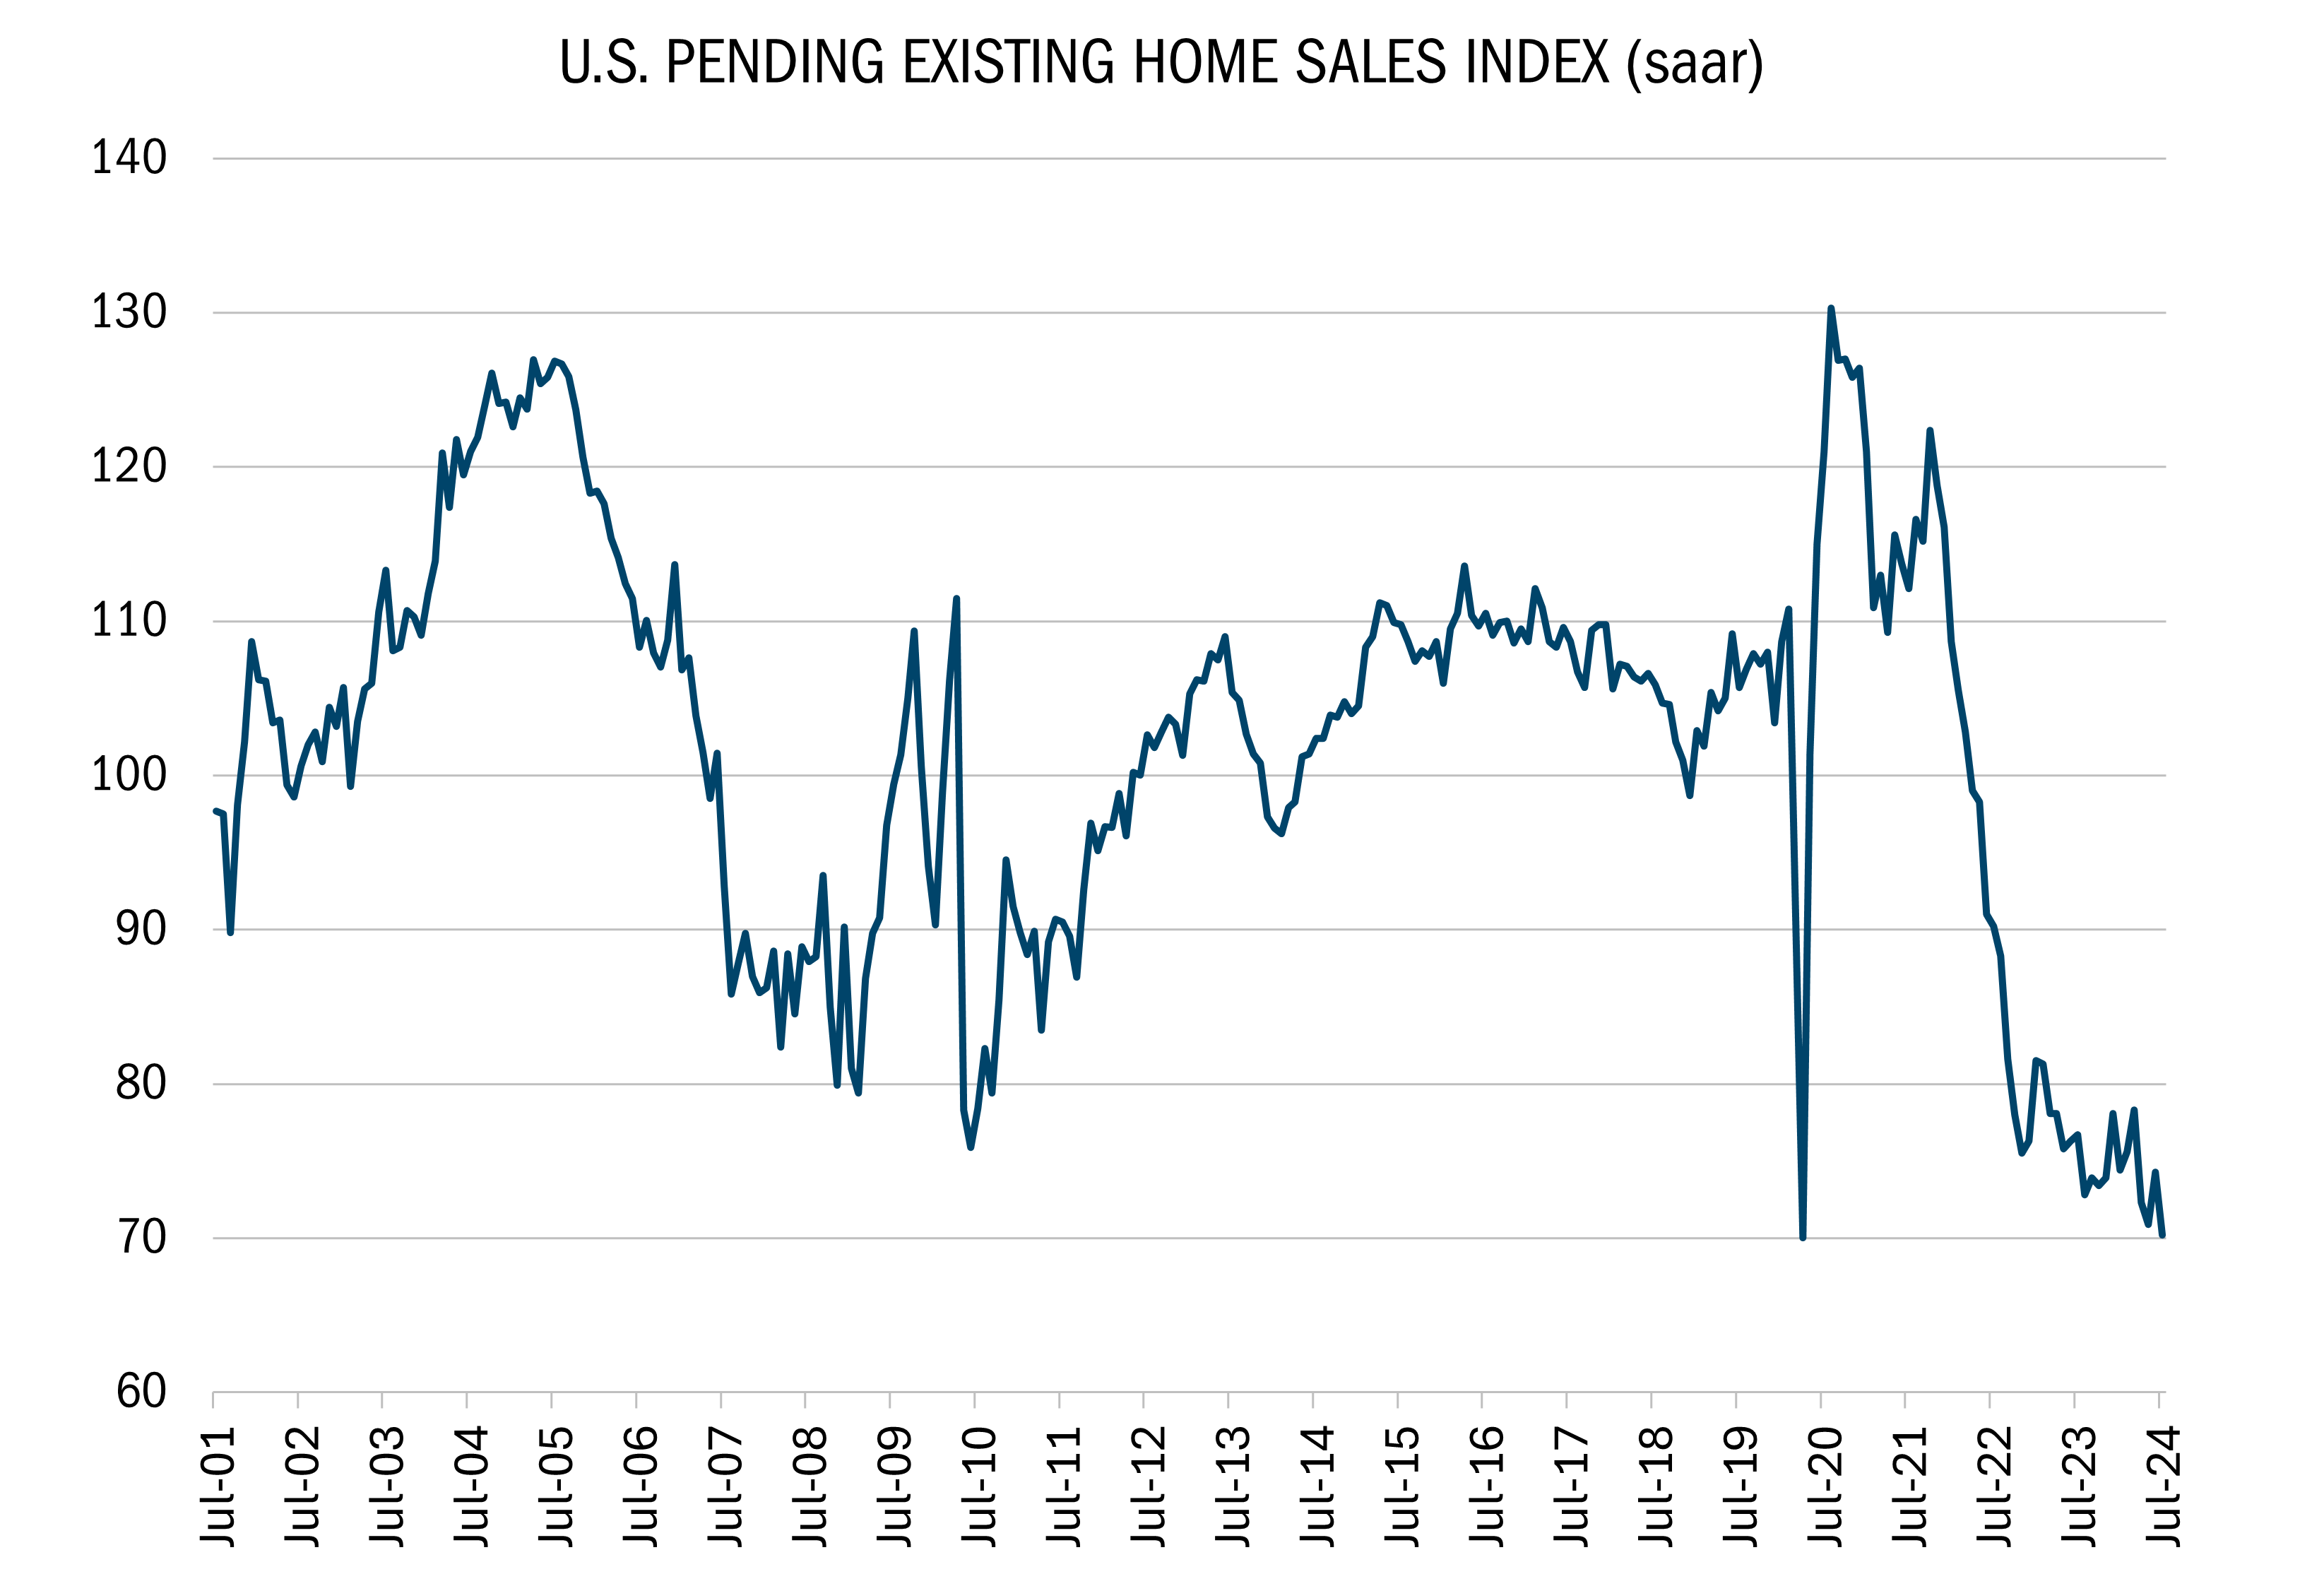
Source: Furey Research Partners, FactSet Research Systems, Inc., and US National Association of Realtors. Monthly data 7/31/01 to 7/31/24. This chart represents US pending existing home sales based upon contracts signed but not closed. All indices are unmanaged. It is not possible to invest in an index. Past performance does not guarantee future results.

While it would certainly be a positive sign if lower borrowing costs were to spark an uptick in demand, we know we can’t bank on it. We take solace in the fact that companies that are actively taking steps to improve their financial strength, competitive advantage, and operational efficiency are being rewarded in this market. By contrast, companies simply waiting around for sales to improve remain under pressure.

Attribution Analysis & Portfolio Activity

In the third quarter, the Value Plus Strategy gained 7.93%, trailing the Russell 2000® Value Index, which returned 10.15%. Stock selection, particularly in the Health Care, Information Technology, and Energy sectors, contributed to the underperformance. However, selection effect helped the Strategy outperform the benchmark in Consumer Discretionary, Industrials, and Financials.

We initiated positions in several new holdings while exiting or reducing our exposure in a handful of others. In some cases, we replaced an existing holding with an industry peer that we consider an upgrade. 

A good example is Gates Industrial Corporation (GTES). This leading manufacturer of belts and hoses for vehicles and industrial machines trades at a more compelling valuation with a better self-help story than Astec Industries, an industrial manufacturer we exited during the quarter.

Over 60% of Gates’ revenues come from regular replacement of mission-critical products, providing stability through the business cycle and pricing power. At the same time, 83% of its sales are generated in markets where the company is among the Top 3 players. As a result, GTES enjoys gross margins in the top quartile of machinery stocks in the Russell 3000® Index. 

Beginning in 2021, the stock came under pressure when Blackstone, which had owned 84% of the stock, began to sell, eventually lowering its stake down to 8%. This created an overhang for the stock while compressing valuations relative to its industrial peers. But recently, this company has embarked on a series of self-help strategies that have reduced material costs, consolidated factories, and focused its efforts on the most profitable segments of its business. This has already led to an improvement of EBITDA margins to 23.5-25.5%, up from 20.9% in 2023, despite a decline in sales. We believe GTES has more margin improvement to come from self-help and an eventual improvement in the manufacturing economy.

GTES shares trade at 8.4X next year’s EBITDA, which is below the multiple for other industrial companies with similar business quality and margin profiles. We don’t believe this discount is warranted. Meanwhile, the stock seems to have significant upside potential as earnings continue to improve through self-help and an improved economy. 

During the quarter, we increased our weighting to another industrial company, Hayward Holdings (HAYW), which makes pool components such as pumps, filters, heaters and cleaners. The company is the second largest player in a trio that controls roughly 90% of the residential pool market in North America. Hayward makes products that are critical for owning a pool but represent a low percentage of the total cost of ownership. This results in pricing power that feeds profitability. HAYW’s gross margins place it in the top 10% of the Russell 3000® Index building products category. 

New pool construction has been on a roller coaster ride lately. After peaking during the pandemic, construction activity has taken a plunge thanks to rising interest rates and fluctuating housing starts. HAYW’s revenues, though, seem to be more resilient because half of the company’s sales come from the replacement of components in existing pools, which tends to be steady throughout an entire cycle. Additionally, pool construction has historically lagged new home construction by around one to three years, and single-family home starts have stabilized after slumping from 2022 to early 2023. Meanwhile, Hayward has implemented self-help strategies that include consolidating manufacturing facilities and implementing Kaizen manufacturing principles, which have improved gross margins by nearly 300 basis points. When pool construction and remodeling pick back up, we believe HAYW will earn significantly more due to its improved gross margin profile and operating leverage as capacity utilization improves. 

Outlook

While the Federal Reserve’s accommodative stance raises hope for an improvement in demand dynamics, it’s important to understand this may not unfold immediately. This is why, regardless of the change in monetary policy, our ultimate goal remains the same: to patiently identify management teams with strong capital allocation policies as a foundation for delivering shareholder returns, guided by our 10 Principles of Value Investing™. We are also confident that companies that are taking steps to improve their competitive and operational standing regardless of economic conditions will be rewarded — especially as green shoots emerge to complement “self-help” operational improvements.
    

Please wait while we gather your results.

Portfolio Management Team

Heartland Advisors Value Investing Portfolio Manager Andrew Fleming

Andrew J. Fleming

Director of Research, Vice President, and Portfolio Manager

Fund Returns

9/30/2024

Scroll over to view complete data

Since Inception (%)20-Year (%)15-Year (%)10-Year (%)5-Year (%)3-Year (%)1-Year (%)YTD* (%)QTD* (%)
Value Plus
Investor Class
9.407.408.166.018.110.668.611.517.93
Value Plus
Institutional Class
9.547.628.436.258.370.898.871.697.98
Russell 2000® Value9.417.749.808.229.293.7725.889.2210.15
*Not annualized

Source: FactSet Research Systems Inc., Russell®, and Heartland Advisors, Inc.

The inception date for the Value Plus Fund is 10/26/1993 for the investor class and 5/1/2008 for the institutional class.

Value Plus Fund Quick Links

Factsheet


Download PDF

Commentary


View Commentary

Attribution & Contribution Reports

Sign In

Holdings


View Holdings


Email Sign Up


©2024 Heartland Advisors | 790 N. Water Street, Suite 1200, Milwaukee, WI 53202 | Business Office: 414-347-7777 | Financial Professionals: 888-505-5180 | Individual Investors: 800-432-7856

In the prospectus dated 5/1/2024, the Gross Fund Operating Expenses for the investor and institutional class of the Value Plus Fund are 1.18% and 0.92%, respectively. The Advisor has voluntarily agreed to waive fees and/or reimburse expenses with respect to the institutional class, to the extent necessary to maintain the institutional class’ “Net Annual Operating Expenses” at a ratio not to exceed 0.99% of average daily net assets. This voluntary waiver/reimbursement may be discontinued at any time. Without such waivers and/or reimbursements, total returns may have been lower.

Past performance does not guarantee future results. Performance represents past performance; current returns may be lower or higher. Performance for institutional class shares prior to their initial offering is based on the performance of investor class shares. The investment return and principal value will fluctuate so that an investor's shares, when redeemed, may be worth more or less than the original cost. All returns reflect reinvested dividends and capital gains distributions, but do not reflect the deduction of taxes that an investor would pay on distributions or redemptions. Subject to certain exceptions, shares of a Fund redeemed or exchanged within 10 days of purchase are subject to a 2% redemption fee. Performance does not reflect this fee, which if deducted would reduce an individual's return. To obtain performance through the most recent month end, call 800-432-7856 or visit heartlandadvisors.com.

An investor should consider the Funds’ investment objectives, risks, and charges and expenses carefully before investing or sending money. This and other important information may be found in the Funds' prospectus. To obtain a prospectus, please call 800-432-7856 or visit heartlandadvisors.com. Please read the prospectus carefully before investing.

As of 9/30/2024, Gates Industrial Corporation PLC (GTES) and Hayward Holdings Inc. (HAYW) represented 0.73% and 2.17% of the Value Plus Fund’s net assets, respectively.

Statements regarding securities are not recommendations to buy or sell.

Portfolio holdings are subject to change. Current and future holdings are subject to risk.

The Value Plus Fund invests in small companies that are generally less liquid and more volatile than large companies. The Fund also invests in a smaller number of stocks (generally 40 to 70) than the average mutual fund. The performance of these holdings generally will increase the volatility of the Fund’s returns.

Value investments are subject to the risk that their intrinsic value may not be recognized by the broad market.

The Value Plus Fund seeks long-term capital appreciation and modest current income.

The Fund’s performance information included in regulatory filings includes a required index that represents an overall securities market (Regulatory Benchmark). In addition, the Fund's regulatory filings may also include an index that more closely aligns to the Fund's investment strategy (Strategy Benchmark(s)). The Fund's performance included in marketing and advertising materials and information other than regulatory filings is generally compared only to the Strategy Benchmark.

The above individuals are registered representatives of ALPS Distributors, Inc.

The Heartland Funds are distributed by ALPS Distributors, Inc.

The statements and opinions expressed in this article are those of the presenter(s). Any discussion of investments and investment strategies represents the presenters’ views as of the date created and are subject to change without notice. The opinions expressed are for general information only and are not intended to provide specific advice or recommendations for any individual. The specific securities discussed, which are intended to illustrate the advisor’s investment style, do not represent all of the securities purchased, sold, or recommended by the advisor for client accounts, and the reader should not assume that an investment in these securities was or would be profitable in the future. Certain security valuations and forward estimates are based on Heartland Advisors’ calculations. Any forecasts may not prove to be true. 

Economic predictions are based on estimates and are subject to change.

There is no guarantee that a particular investment strategy will be successful.

Sector and Industry classifications are sourced from GICS®.The Global Industry Classification Standard (GICS®) is the exclusive intellectual property of MSCI Inc. (MSCI) and S&P Global Market Intelligence (“S&P”).  Neither MSCI, S&P, their affiliates, nor any of their third party providers (“GICS Parties”) makes any representations or warranties, express or implied, with respect to GICS or the results to be obtained by the use thereof, and expressly disclaim all warranties, including warranties of accuracy, completeness, merchantability and fitness for a particular purpose.  The GICS Parties shall not have any liability for any direct, indirect, special, punitive, consequential or any other damages (including lost profits) even if notified of such damages.

Heartland Advisors defines market cap ranges by the following indices: micro-cap by the Russell Microcap®, small-cap by the Russell 2000®, mid-cap by the Russell Midcap®, large-cap by the Russell Top 200®.

Because of ongoing market volatility, performance may be subject to substantial short-term changes.

Dividends are not guaranteed and a company’s future ability to pay dividends may be limited. A company currently paying dividends may cease paying dividends at any time.

In certain cases, dividends and earnings are reinvested.

There is no assurance that dividend-paying stocks will mitigate volatility.

CFA® is a registered trademark owned by the CFA Institute.

Russell Investment Group is the source and owner of the trademarks, service marks and copyrights related to the Russell Indices. Russell® is a trademark of the Frank Russell Investment Group.

Data sourced from FactSet: Copyright 2024 FactSet Research Systems Inc., FactSet Fundamentals. All rights reserved.

Artificial intelligence (AI) is intelligence—perceiving, synthesizing, and inferring information—demonstrated by computers, as opposed to intelligence displayed by humans or by other animals. Dividend Yield is a ratio that shows how much a company pays out in dividends each year relative to its share price.  Earnings Before Interest, Taxes, Depreciation and Amortization (EBITDA) measures a company’s financial performance. It is used to analyze and compare profitability between companies and industries because it eliminates the effects of financing and accounting decisions. Free Cash Flow is the amount of cash a company has after expenses, debt service, capital expenditures, and dividends. The higher the free cash flow, the stronger the company’s balance sheet. Leverage is the amount of debt used to finance a firm's assets. A firm with significantly more debt than equity is considered to be highly leveraged. Operating Leverage is a measurement of the degree to which a firm or project incurs a combination of fixed and variable costs. A business that makes sales providing a very high gross margin and fewer fixed costs and variable costs is considered to have high leverage. The higher the degree of operating leverage, the greater the magnitude of changes in sales to potential profits. Russell Investment Group is the source and owner of the trademarks, service marks and copyrights related to the Russell Indices. Russell® is a trademark of the Russell Investment Group.  Russell 2000® Index includes the 2000 firms from the Russell 3000® Index with the smallest market capitalizations. All indices are unmanaged. It is not possible to invest directly in an index. Russell 2000® Value Index measures the performance of those Russell 2000® companies with lower price/book ratios and lower forecasted growth characteristics. All indices are unmanaged. It is not possible to invest directly in an index. S&P 500 Index is an index of 500 U.S. stocks chosen for market size, liquidity and industry group representation and is a widely used U.S. equity benchmark. All indices are unmanaged. It is not possible to invest directly in an index. 10 Principles of Value Investing™ consist of the following criteria for selecting securities: (1) catalyst for recognition; (2) low price in relation to earnings; (3) low price in relation to cash flow; (4) low price in relation to book value; (5) financial soundness; (6) positive earnings dynamics; (7) sound business strategy; (8) capable management and insider ownership; (9) value of company; and (10) positive technical analysis.

Heartland’s investing glossary provides definitions for several terms used on this page.

top