Heartland Advisors

Heartland Mid Cap Value Fund 3Q24 Portfolio Manager Commentary

Executive Summary

  • The risk-on mood heading into the Federal Reserve interest rate cuts drove successive all-time highs in the stock market, despite broadening signs of fundamental deterioration across several industries.
  • While the Federal Reserve essentially declared victory in containing inflation, it is unknown what the final collateral damage will be to the job market and economy.
  • In an environment where higher volatility is a distinct possibility, it is important to have a watchlist of companies to monitor for improving risk/reward profiles — and a process that allows you to invest opportunistically and decisively. We consider this more productive than trying to precisely forecast economic outcomes. 

Past performance is no guarantee of future results and investment returns and principal value of the Fund will fluctuate so that shares, when redeemed, may be worth more or less than the original cost. Current performance may be higher or lower than the performance quoted. Call 800-432-7856 or visit heartlandadvisors.com for current month end performance.

Third Quarter Market Discussion

For most of the quarter, the market was fixated on when the Federal Reserve would cut interest rates and by how much. That anticipation helped lift the Russell Midcap® Index up more than 8% from the start of the quarter through Sept. 18, when the central bank lowered rates by half a percentage point. Now that the easing cycle has begun, the knee-jerk ‘risk-on’ reaction seems to have shifted to being risk aware.

Federal Reserve Chairman Jerome Powell made it clear that combatting weakness in the labor market is now a bigger concern for the central bank than fighting inflation. Going forward, this suggests to us that payroll data will be more important to the mood of the markets than monthly updates of inflation indicators like Consumer Price Index. On the jobs front, the news may not be great. 

While policymakers anticipate making two more cuts before the end of the year, based on the Federal Reserve’s so-called ‘dot plot,’ the employment outlook is likely to get worse before it gets better. Recent surveys by Federal Reserve regional banks in New York, Philadelphia, Dallas, and Kansas City show manufacturing employment contracting. Meanwhile, there has been a strong historical correlation between the unemployment rate and two economic indicators — the NFIB Small Business Optimism Index and the ISM Purchasing Managers Index. Ongoing weakness in both indicates the potential for unemployment to climb from 4.2% today to around 6% (see below).  

US Personal Savings

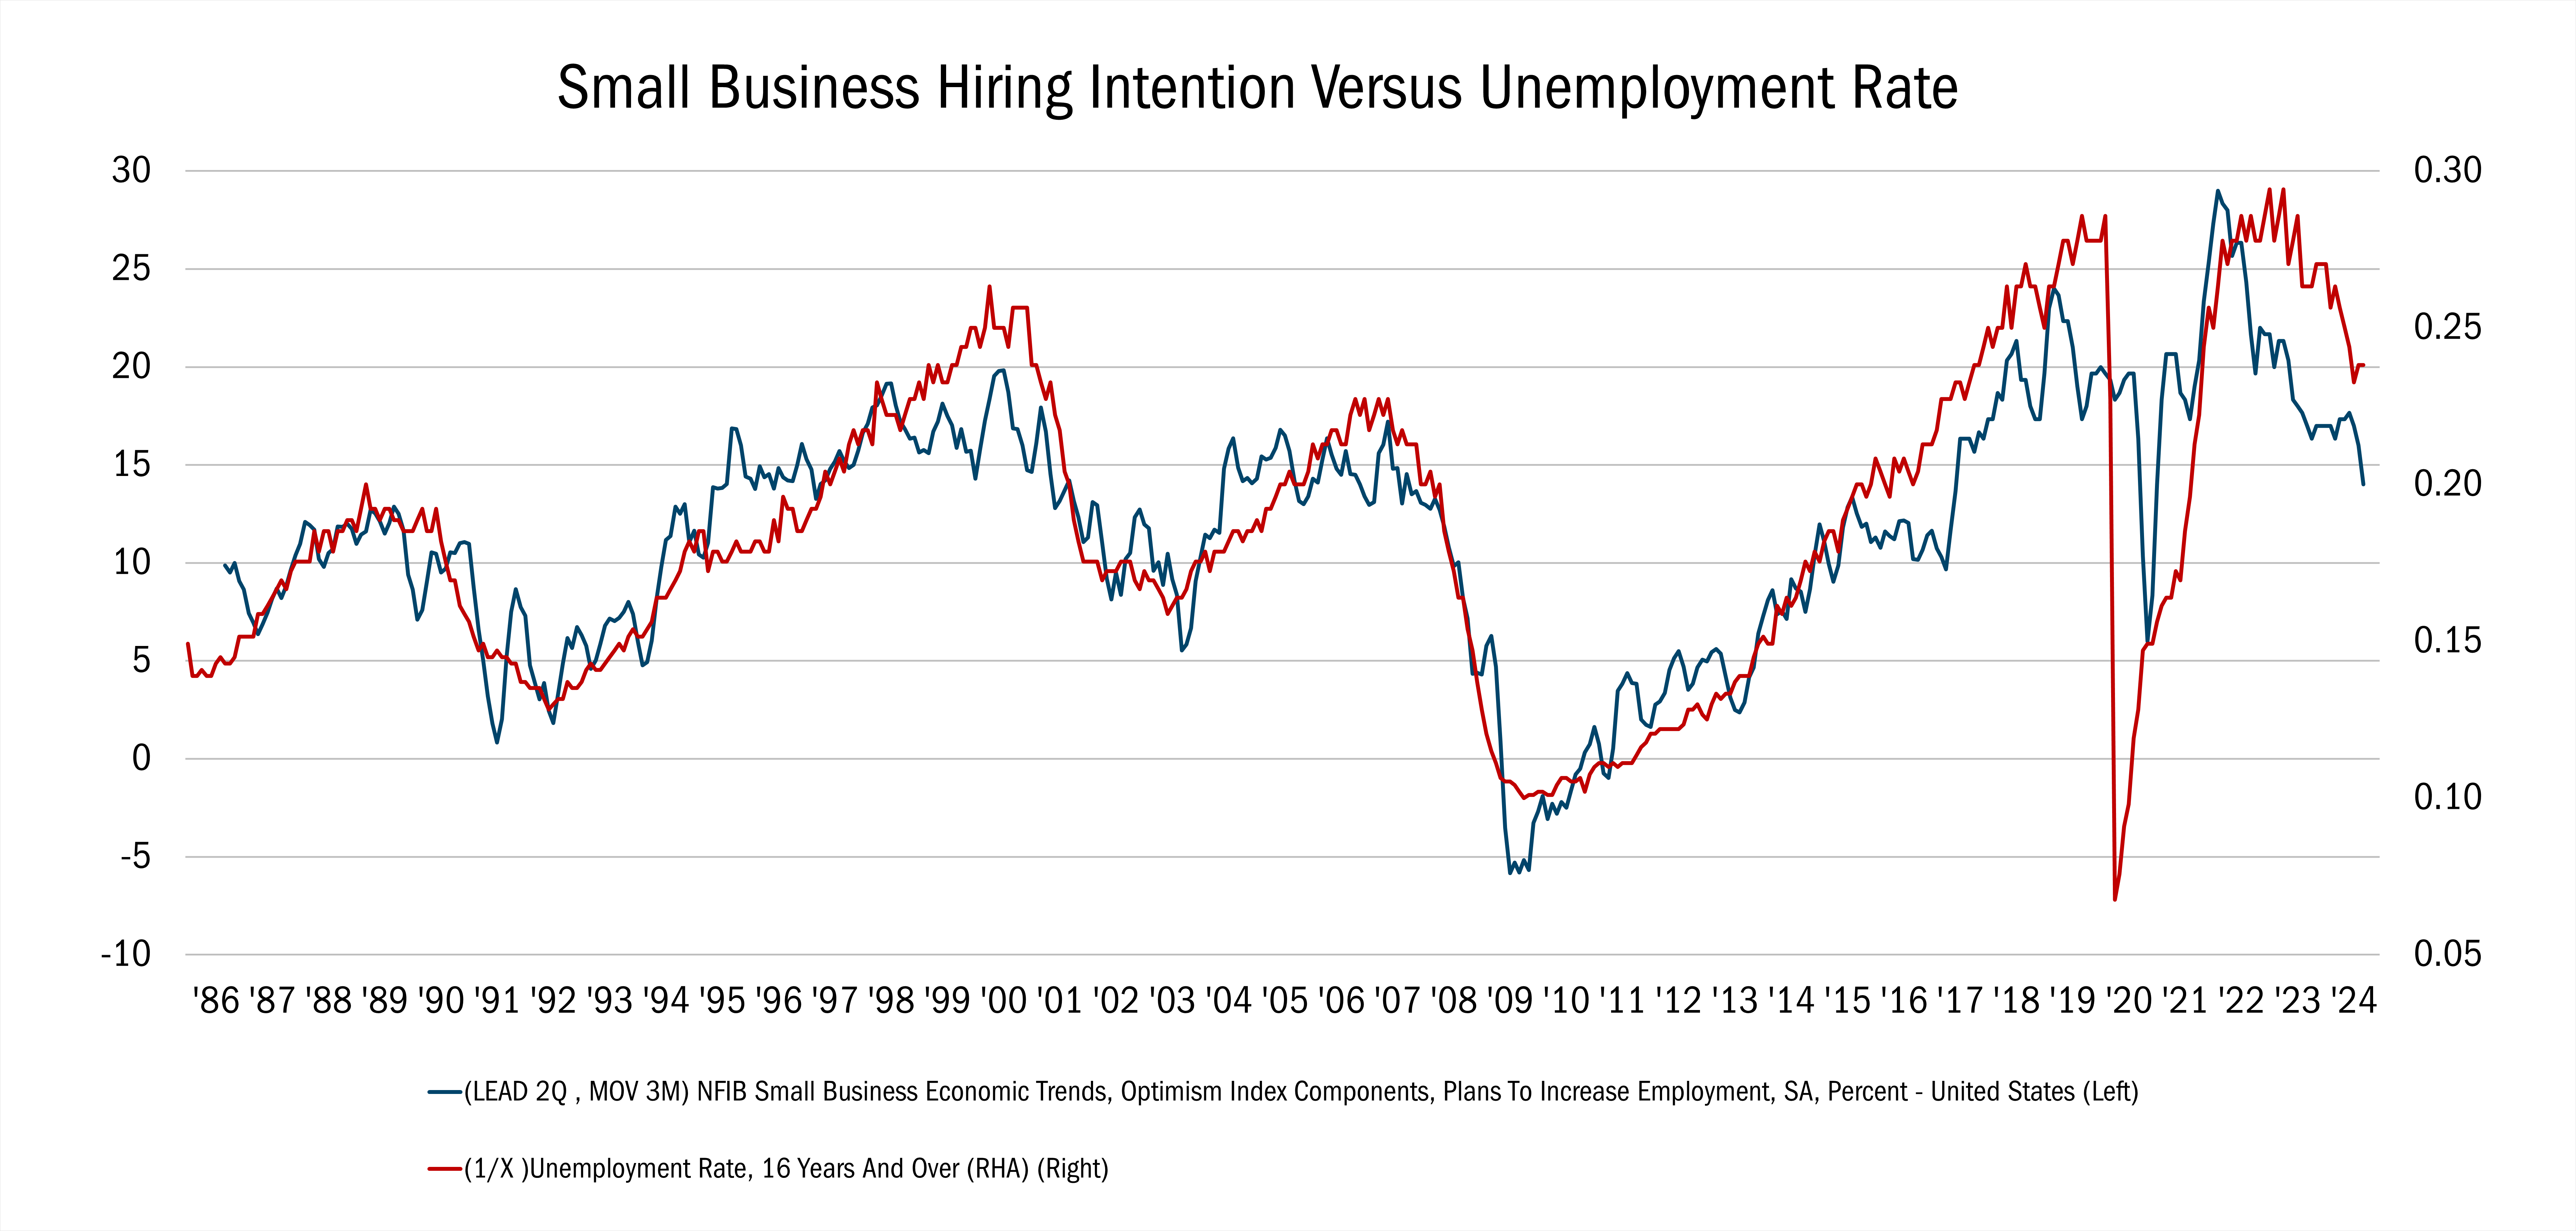
Source: FactSet Research Systems Inc., 1/31/1986 to 9/30/2024. This chart represents small businesses’ hiring intention compared to the unemployment rate. All indices are unmanaged. It is not possible to invest directly in an index. Past performance does not guarantee future results.

Against this backdrop, many investors will be looking to see if there is more collateral economic damage to come in the near term. Down the road, a silver lining in all of this could be that prospective stock returns are generally better from higher unemployment rates rather than low unemployment levels. That said, one should expect the unexpected along the way. Chalk it up to one of Warren Buffett’s rules — it pays to be greedy when others are fearful, a sentiment that works hand in glove with our 10 Principles of Value Investing™.

Attribution Analysis

The Mid Cap Value portfolio returned 8.24% in the third quarter, trailing the Russell Midcap® Value Index, which gained around 10.1%. Stock selection was positive in six of 11 sectors, led by Materials, Financials, Real Estate, Consumer Discretionary, Utilities, and Health Care. Despite our relative outperformance in those areas, we were underweight Consumer Discretionary, Real Estate, and Financials compared to the midcap value benchmark. At the same time, we were overweight in some sectors where our security selection was negative for the quarter, such as Consumer Staples, Energy, and Industrials. Over the past three- and five-years, our Strategy outperformed the Russell Midcap® Value Index driven almost entirely by security selection.

Portfolio Activity

In constructing our portfolio, we are guided by rules that keep us disciplined and help ensure that we can replicate our process. We start with a bottom-up approach that seeks to have security selection drive our performance. Overlaying our 10 Principles of Value Investing™, we implement a two-bucket strategy by seeking to own both high-quality companies trading at decent bargains (“quality value”) and deeply discounted companies that have produced poor economic returns over time (“deep value”). However, within deep value, we aim for companies that have identified an internal change agent that could help the company achieve its potential from an intrinsic value and share price perspective. We do this because these two styles within value investing tend to alternate market leadership, just as growth and value strategies generally take turns outperforming.

For every stock we consider, we also establish four price targets that allow us to consider how the market might value each of those companies under different scenarios. This gives us a framework for assessing stocks under various market conditions so that if circumstances change quickly, we can act decisively to take advantage of opportunities. This is particularly useful for stocks we keep on our watchlists, where a resumption of volatility could improve the risk-reward profile of the company. 
 

Industrials. A company we added from our watchlist this quarter was Robert Half (RHI), a leading temporary staffing and consulting firm that places finance, accounting, and technology experts at small- and medium-sized businesses. Robert Half is an example of a quality value bucket company that we have owned in the past and that we can buy with confidence in the face of a business cycle slowdown. That confidence stems from a belief in the company’s competitive positioning, balance sheet, capital allocation, and proven ability to compound value for its owners over time. This is a playbook we have applied many times before when good businesses are going through a “soft patch.”

We originally held RHI in 2017 and 2018, during a cyclical downturn and subsequent recovery. We revisited RHI in the third quarter of this year after the company’s latest earnings call, in which management indicated that temporary staffing revenue had been lower on a year-over-year basis for seven consecutive quarters. By comparison, this length of decline is comparable to the recessionary conditions experienced in 2001-2002 and 2008-2009.

We believe the durability of RHI’s cash flows should prove greater than what the market is pricing in, and we are confident the company is underearning relative to normalized profitability. RHI enjoys industry-leading profitability and free cash flow generation. The company has no debt and has $500 million of cash on its balance sheet, which itself is worth more than $5 a share.

It goes without saying that staffing is a deeply cyclical business, and unemployment seems to be going the wrong way. Despite this reality, RHI historically tends to outperform the Russell Midcap® Value Index when the job market worsens. The stock is currently trading at relatively high earnings multiple, but we consider that a function of depressed profits. The stock’s free cash flow/enterprise value yield stands at more than 5% today — and greater than 10% based on what we believe is mid-cycle profitability. Meanwhile, 100% of Robert Half’s free cash flow is being returned to shareholders through dividend growth and buybacks.

Health Care. Another new holding from our quality value watchlist is Smith and Nephew plc (SNN), a leading medical device company for advanced wound care, sports medicine, and orthopedics.

The company has been hard at work for over two years implementing a badly needed self-help playbook. Those efforts are increasingly bearing fruit. While SNN’s wound care business enjoys a strong return on invested capital, its orthopedics group is well below peers or what is deemed acceptable. Management is taking several measures to improve asset utilization and capital allocation. Fixing the orthopedic segment’s performance can unlock significant value for shareholders.

The company has made considerable progress addressing high turnover among sales reps and filling gaps in its U.S. territory leadership. The company has also been improving several functions including manufacturing quality, warehouse productivity, third-party procurement, U.S. sales productivity, marketing efficiency, and overhead spending. The impact is already being felt, as shipments of its orthopedic knee products reached target levels in the second quarter, following a similar achievement for hips at the end of last year. That said, there remains work to be done as evidenced by the ortho segment’s meager revenue-per-manufacturing square foot compared to industry peers.

At 11X Enterprise Value-to-EBITDA, SNN trades at a significant discount to industry peers. Furthermore, profit margins are depressed by several hundred basis points due to the ortho segment inefficiencies. Continued progress on market share performance and operational streamlining should yield a “virtuous circle” of both margin growth and multiple expansion, in our view.

Consumer Staples. The convenience store operator Dollar General (DG) was our worst performer during the quarter. The retailer, with more than 19,000 stores, 80% of which are in rural towns with populations of less than 20,000, recently slashed its 2024 earnings guidance, sparking a late-summer sell-off.  

Same-store comparable sales and margin guidance were cut meaningfully, implying a significant slowdown in the second half of the year. While some of the troubles may be due to the financial challenges of its core customers, with average incomes of just $35,000, Dollar General is also losing market share because of Walmart’s initiative to reduce entry-level pricing. Management acknowledged a need to invest in promotions to stimulate demand, but they refute concerns that DG needs to invest more in store-level labor.

We exited the position and harvested the tax losses, but we continue to monitor the company’s fundamentals. We’re looking for comparable sales to stabilize driven by promotional activity, a boost in labor investments, and management to downsize store expansion plans to improve free cash flow generation and accelerate deleveraging efforts.

Outlook 

Though the Federal Reserve has finally begun its eagerly anticipated easing cycle, the move hasn’t flipped an automatic switch. The same economic concerns that drove the central bank to shift focus away from inflation and towards supporting jobs is likely to continue to motivate investors going forward. We believe this mix of cautiousness over the labor market and optimism surrounding rate cuts calls for discipline and patience, which reminds us of a famous Buffett saying: “We don’t have to be smarter than the rest. We just have to be more disciplined than the rest.” For us, that means not overreacting to the current news while staying true to our 10 Principles of Value Investing™, which have guided our Fund successfully for a decade since launching nearly ten years ago.

Please wait while we gather your results.

Portfolio Management Team

Heartland Advisors Value Investing Portfolio Manager Colin McWey

Colin McWey

Vice President and Portfolio Manager

Heartland Advisors Value Investing Portfolio Manager Will Nasgovitz

Will Nasgovitz

CEO and Portfolio Manager

Heartland Advisors Value Investing Portfolio Manager Troy McGlone

Troy McGlone

Vice President and Portfolio Manager

Fund Returns

9/30/2024

Scroll over to view complete data

Since Inception (%)20-Year (%)15-Year (%)10-Year (%)5-Year (%)3-Year (%)1-Year (%)YTD* (%)QTD* (%)
Mid Cap Value
Investor Class
9.62---12.268.4517.939.668.24
Mid Cap Value
Institutional Class
9.89---12.538.7418.159.828.33
Russell Midcap® Value8.64---10.337.3929.0115.0810.08
*Not annualized

Source: FactSet Research Systems Inc., Russell®, and Heartland Advisors, Inc.

The inception date for the Mid Cap Value Fund is 10/31/2014 for the investor and institutional class.

Mid Cap Value Fund Quick Links

Factsheet


Download PDF

Commentary


View Commentary

Attribution & Contribution Reports

Sign In

Holdings


View Holdings


Email Sign Up


©2024 Heartland Advisors | 790 N. Water Street, Suite 1200, Milwaukee, WI 53202 | Business Office: 414-347-7777 | Financial Professionals: 888-505-5180 | Individual Investors: 800-432-7856

In the prospectus dated 5/1/2024, the Net Fund Operating Expenses for the investor and institutional classes of the Mid Cap Value Fund are 1.10% and 0.85%, respectively. The Advisor has contractually agreed to waive its management fees and/or reimburse expenses of the Fund to ensure that Net Fund Operating Expenses for the Fund do not exceed 1.10% of the Fund’s average net assets for the investor class shares and 0.85% for the institutional class shares, through at least 4/5/2026, and subject thereafter to annual reapproval of the agreement by the Board of Directors. Without such waiver and/or reimbursements, the Gross Fund Operating Expenses would be 1.17% for the investor class shares and 0.95% for the institutional class shares.

Past performance does not guarantee future results. Performance represents past performance; current returns may be lower or higher. Performance for institutional class shares prior to their initial offering is based on the performance of investor class shares. The investment return and principal value will fluctuate so that an investor's shares, when redeemed, may be worth more or less than the original cost. All returns reflect reinvested dividends and capital gains distributions, but do not reflect the deduction of taxes that an investor would pay on distributions or redemptions. Subject to certain exceptions, shares of a Fund redeemed or exchanged within 10 days of purchase are subject to a 2% redemption fee. Performance does not reflect this fee, which if deducted would reduce an individual's return. To obtain performance through the most recent month end, call 800-432-7856 or visit heartlandadvisors.com.

An investor should consider the Funds’ investment objectives, risks, and charges and expenses carefully before investing or sending money. This and other important information may be found in the Funds' prospectus. To obtain a prospectus, please call 800-432-7856 or visit heartlandadvisors.com. Please read the prospectus carefully before investing.

As of 9/30/2024, Robert Half International, Inc. (RHI), and Smith & Nephew PLC ADR (SNN) represented 1.61% and 2.01% of the Mid Cap Value Fund’s net assets, respectively. Dollar General Corporation (DG) is unowned by the Mid Cap Value Fund.  

Statements regarding securities are not recommendations to buy or sell.

Portfolio holdings are subject to change. Current and future portfolio holdings are subject to risk.

The Mid Cap Value Fund invests in a smaller number of stocks (generally 40 to 60) than the average mutual fund. The performance of these holdings generally will increase the volatility of the Fund’s returns. The Fund also invests in mid-sized companies on a value basis. Mid-sized securities generally are more volatile and less liquid than those of larger companies.

Value investments are subject to the risk that their intrinsic value may not be recognized by the broad market.

The Mid Cap Value Fund seeks long-term capital appreciation and modest current income.

The Fund’s performance information included in regulatory filings includes a required index that represents an overall securities market (Regulatory Benchmark). In addition, the Fund's regulatory filings may also include an index that more closely aligns to the Fund's investment strategy (Strategy Benchmark(s)). The Fund's performance included in marketing and advertising materials and information other than regulatory filings is generally compared only to the Strategy Benchmark.

The above individuals are registered representatives of ALPS Distributors, Inc.

The Heartland Funds are distributed by ALPS Distributors, Inc.

The statements and opinions expressed in this article are those of the presenter(s). Any discussion of investments and investment strategies represents the presenters’ views as of the date created and are subject to change without notice. The opinions expressed are for general information only and are not intended to provide specific advice or recommendations for any individual. The specific securities discussed, which are intended to illustrate the advisor’s investment style, do not represent all of the securities purchased, sold, or recommended by the advisor for client accounts, and the reader should not assume that an investment in these securities was or would be profitable in the future. Certain security valuations and forward estimates are based on Heartland Advisors’ calculations. Any forecasts may not prove to be true. 

Economic predictions are based on estimates and are subject to change.

There is no guarantee that a particular investment strategy will be successful.

Sector and Industry classifications are sourced from GICS®.The Global Industry Classification Standard (GICS®) is the exclusive intellectual property of MSCI Inc. (MSCI) and S&P Global Market Intelligence (“S&P”).  Neither MSCI, S&P, their affiliates, nor any of their third party providers (“GICS Parties”) makes any representations or warranties, express or implied, with respect to GICS or the results to be obtained by the use thereof, and expressly disclaim all warranties, including warranties of accuracy, completeness, merchantability and fitness for a particular purpose.  The GICS Parties shall not have any liability for any direct, indirect, special, punitive, consequential or any other damages (including lost profits) even if notified of such damages.

Heartland Advisors defines market cap ranges by the following indices: micro-cap by the Russell Microcap®, small-cap by the Russell 2000®, mid-cap by the Russell Midcap®, large-cap by the Russell Top 200®.

Because of ongoing market volatility, performance may be subject to substantial short-term changes.

Dividends are not guaranteed and a company’s future ability to pay dividends may be limited. A company currently paying dividends may cease paying dividends at any time.

There is no assurance that dividend-paying stocks will mitigate volatility.

CFA® is a registered trademark owned by the CFA Institute.

Russell Investment Group is the source and owner of the trademarks, service marks and copyrights related to the Russell Indices. Russell® is a trademark of the Frank Russell Investment Group.

Data sourced from FactSet: Copyright 2024 FactSet Research Systems Inc., FactSet Fundamentals. All rights reserved.

Heartland’s investing glossary provides definitions for several terms used on this page.

Artificial intelligence (AI) is intelligence—perceiving, synthesizing, and inferring information—demonstrated by computers, as opposed to intelligence displayed by humans or by other animals. Bottom-up is an investment approach that de-emphasizes the significance of economic and market cycles. This approach focuses on the analysis of individual stocks and the investor focuses his or her attention on a specific company rather than on the industry in which that company operates or on the economy as a whole. Cyclical Stocks cover Basic Materials, Capital Goods, Communications, Consumer Cyclical, Energy, Financial, Technology, and Transportation which tend to react to a variety of market conditions that can send them up or down and often relate to business cycles. Free Cash Flow is the amount of cash a company has after expenses, debt service, capital expenditures, and dividends. The higher the free cash flow, the stronger the company’s balance sheet. Insider Buying is the purchase of a company's stock by individual directors, executives or other employees. Intrinsic Value is the actual value of a company or an asset based on an underlying perception of its true value including all aspects of the business, in terms of both tangible and intangible factors. This value may or may not be the same as the current market value. ISM Manufacturing PMI (Purchasing Managers Index) is an index based on surveys of more than 400 manufacturing firms by the Institute for Supply Management (ISM). The PMI index is an indicator of the economic health of the manufacturing sector based on five major indicators: new orders, inventory levels, production, supplier deliveries and the employment environment. A reading over 50 represents that the industry is expanding, under 50 represents a contraction, while a reading at 50 represents no change. Russell Investment Group is the source and owner of the trademarks, service marks and copyrights related to the Russell Indices. Russell® is a trademark of the Russell Investment Group. Russell Midcap® Value Index measures the performance of those Russell Midcap® Index companies with lower price/book ratios and lower forecasted growth characteristics. All indices are unmanaged. It is not possible to invest directly in an index. S&P 500 Index is an index of 500 U.S. stocks chosen for market size, liquidity and industry group representation and is a widely used U.S. equity benchmark. All indices are unmanaged. It is not possible to invest directly in an index. 10 Principles of Value Investing™ consist of the following criteria for selecting securities: (1) catalyst for recognition; (2) low price in relation to earnings; (3) low price in relation to cash flow; (4) low price in relation to book value; (5) financial soundness; (6) positive earnings dynamics; (7) sound business strategy; (8) capable management and insider ownership; (9) value of company; and (10) positive technical analysis.

top